常见食物的营养--大数据分析
常见食物的营养--大数据分析
- 选题背景
在整个生命历程中保持健康饮食有助于预防各种类型的营养不良和一系列非传染性疾病和病症。食物中的营养是我们获取燃料的方式,为我们的身体提供能量。我们需要每天用新的供应来补充体内的营养。脂肪、蛋白质和碳水化合物都是必需的。营养学是解释食物中与生物体的维持,生长,繁殖,健康和疾病有关的营养素和其他物质的科学。它包括摄入,吸收,同化,生物合成,分解代谢和排泄。然而,随着加工食品数量不断增多,快速城市化,以及不断演变的生活方式,人们的饮食模式发生了改变。现在,人们食用更多富含能量、脂肪、游离糖和盐/钠的食品,许多人没有食用足够的水果、蔬菜以及其他膳食纤维(例如全谷类)。多样化、平衡和健康饮食的确切构成因个人情况(例如年龄、性别、生活方式以及身体活动程度等)、文化背景、本地可获得的食物以及饮食习俗而异,而构成健康饮食的基本原则保持不变。
2.大数据分析方案
从网址中下载完数据后,在python环境中导入pandas、plotly等库进行数据整理,经过数据清洗,检查数据等,然后进行可视化处理,找出常见食物的营养价值,完成数据分析。
数据集来源:网址:www.kaggle.com
参考:数据分析可视化方红生,关于常见食品营养大数据分析
3. 数据分析步骤
(1)数据清洗
#导入库并定义用于绘制数据的函数
import pandas as pd
import plotly.express as px
from plotly.subplots import make_subplots
import plotly.graph_objects as go

#读取文档
nutrients=pd.read_csv("D:/文档/python高级应用/nutrients_csvfile.csv")
nutrients.head()

#数据中的 t用0代替。t表示食品中的微量
nutrients = nutrients.replace("t", 0)
nutrients = nutrients.replace("t'", 0)
nutrients.head()

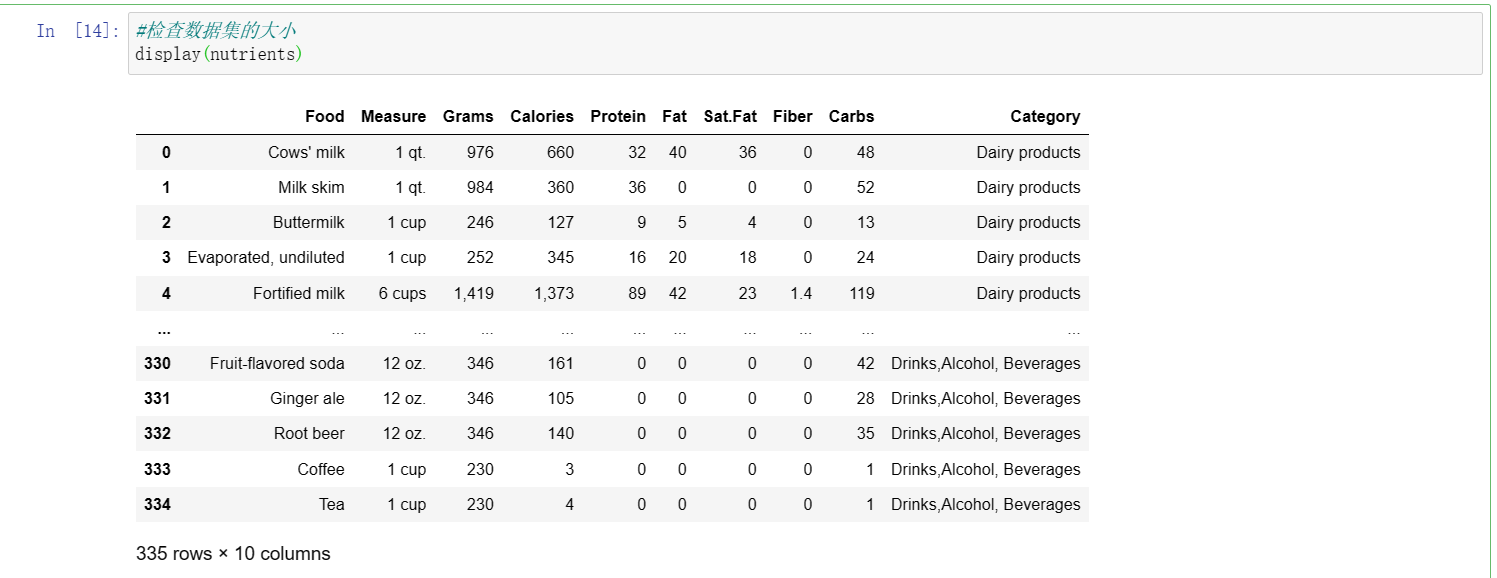
#检查数据集的大小
display(nutrients)
#将逗号转换为相应 int 或浮点变量的数字数据
nutrients = nutrients.replace(",","", regex=True)
nutrients['Protein'] = nutrients['Protein'].replace("-1","", regex=True)
nutrients['Fiber'] = nutrients['Fiber'].replace("a","", regex=True)
nutrients['Calories'][91] = (8+44)/2
#将克、卡路里、蛋白质、脂肪、饱和脂肪、纤维和碳水化合物数据类型转换为 int
nutrients['Grams'] = pd.to_numeric(nutrients['Grams'])
nutrients['Calories'] = pd.to_numeric(nutrients['Calories'])
nutrients['Protein'] = pd.to_numeric(nutrients['Protein'])
nutrients['Fat'] = pd.to_numeric(nutrients['Fat'])
nutrients['Sat.Fat'] = pd.to_numeric(nutrients['Sat.Fat'])
nutrients['Fiber'] = pd.to_numeric(nutrients['Fiber'])
nutrients['Carbs'] = pd.to_numeric(nutrients['Carbs'])
#检查数据类型改变的结果
nutrients.dtypes

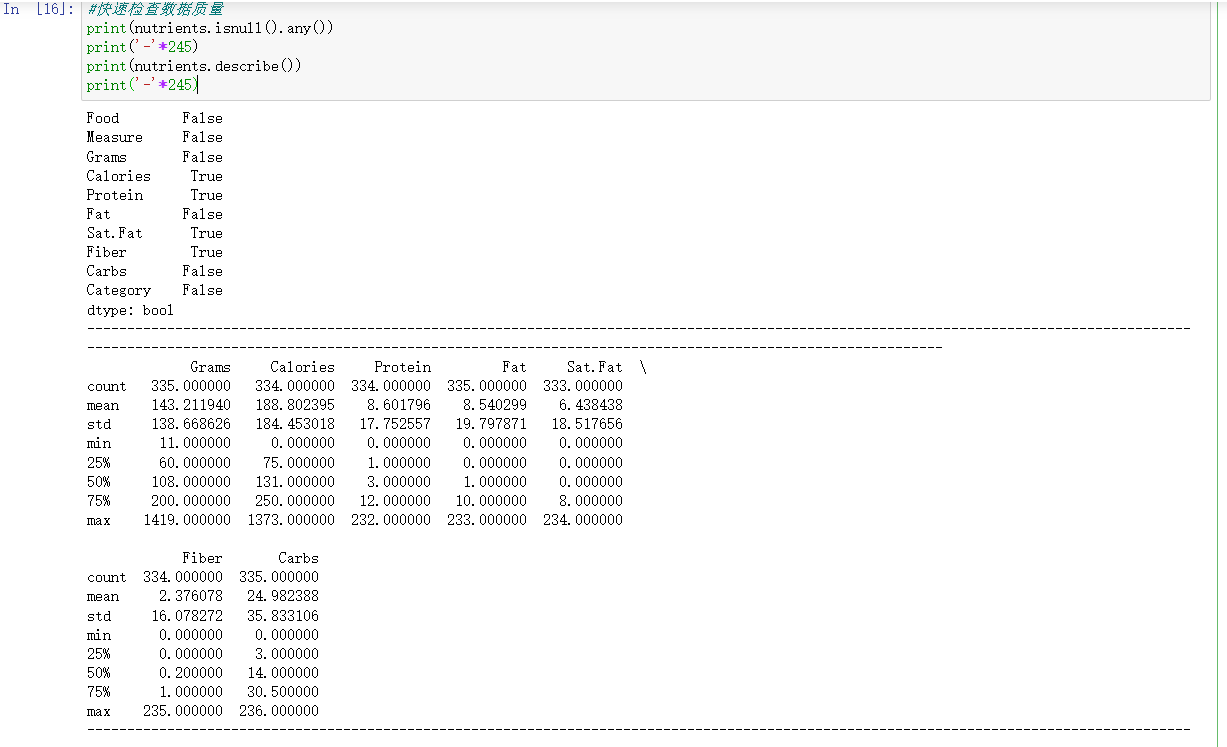
#检查数据质量
print(nutrients.isnull().any())
print('-'*245)
print(nutrients.describe())
print('-'*245)
#空值清除
nutrients = nutrients.dropna()
display(nutrients)

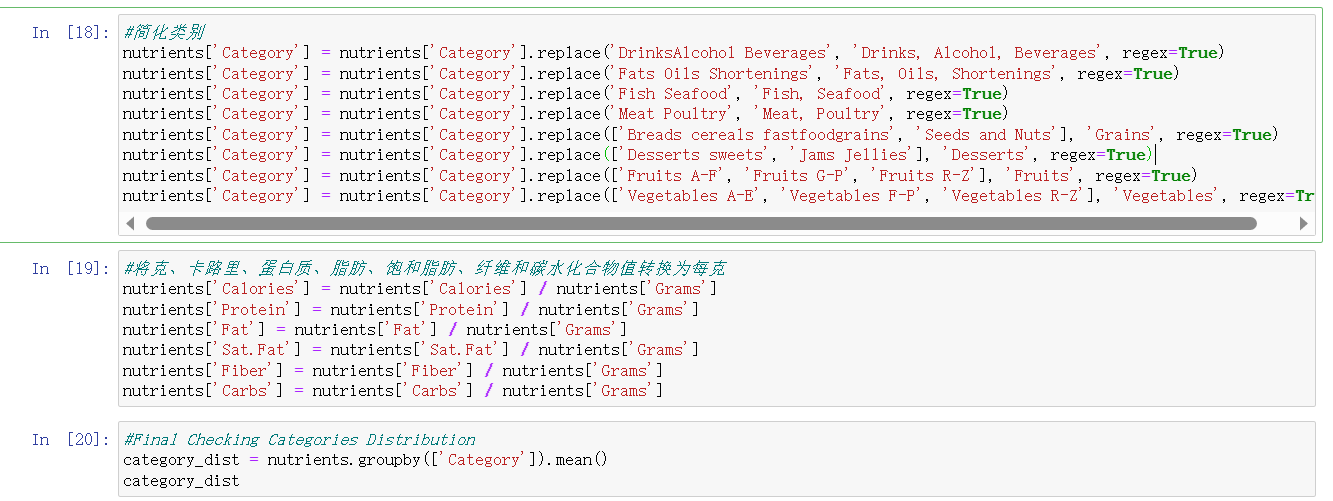
#简化类别
nutrients['Category'] = nutrients['Category'].replace('DrinksAlcohol Beverages', 'Drinks, Alcohol, Beverages', regex=True)
nutrients['Category'] = nutrients['Category'].replace('Fats Oils Shortenings', 'Fats, Oils, Shortenings', regex=True)
nutrients['Category'] = nutrients['Category'].replace('Fish Seafood', 'Fish, Seafood', regex=True)
nutrients['Category'] = nutrients['Category'].replace('Meat Poultry', 'Meat, Poultry', regex=True)
nutrients['Category'] = nutrients['Category'].replace(['Breads cereals fastfoodgrains', 'Seeds and Nuts'], 'Grains', regex=True)
nutrients['Category'] = nutrients['Category'].replace(['Desserts sweets', 'Jams Jellies'], 'Desserts', regex=True)
nutrients['Category'] = nutrients['Category'].replace(['Fruits A-F', 'Fruits G-P', 'Fruits R-Z'], 'Fruits', regex=True)
nutrients['Category'] = nutrients['Category'].replace(['Vegetables A-E', 'Vegetables F-P', 'Vegetables R-Z'], 'Vegetables', regex=True)
#将克、卡路里、蛋白质、脂肪、饱和脂肪、纤维和碳水化合物值转换为每克
nutrients['Calories'] = nutrients['Calories'] / nutrients['Grams']
nutrients['Protein'] = nutrients['Protein'] / nutrients['Grams']
nutrients['Fat'] = nutrients['Fat'] / nutrients['Grams']
nutrients['Sat.Fat'] = nutrients['Sat.Fat'] / nutrients['Grams']
nutrients['Fiber'] = nutrients['Fiber'] / nutrients['Grams']
nutrients['Carbs'] = nutrients['Carbs'] / nutrients['Grams']
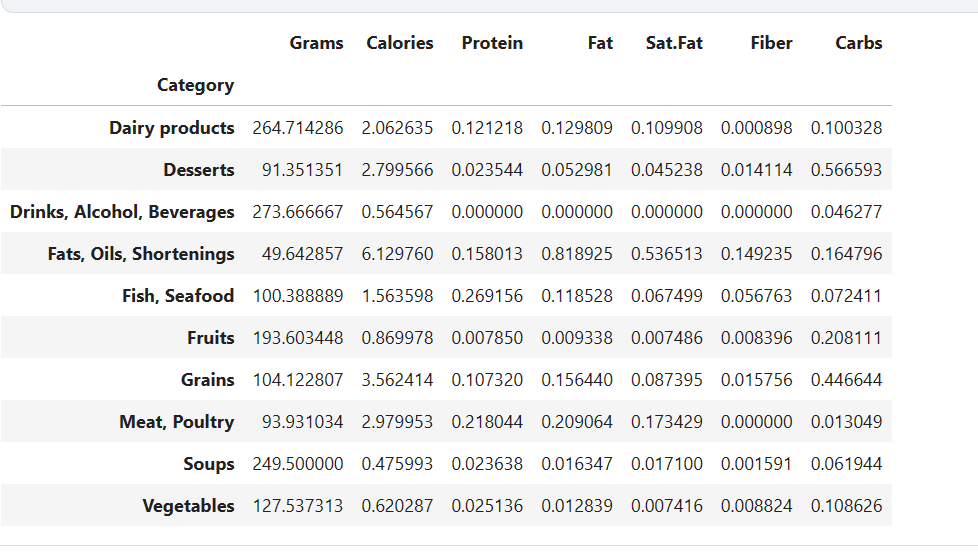
#检查最终的数据结果
category_dist = nutrients.groupby(['Category']).mean()
category_dist
 (2)数据可视化与分析
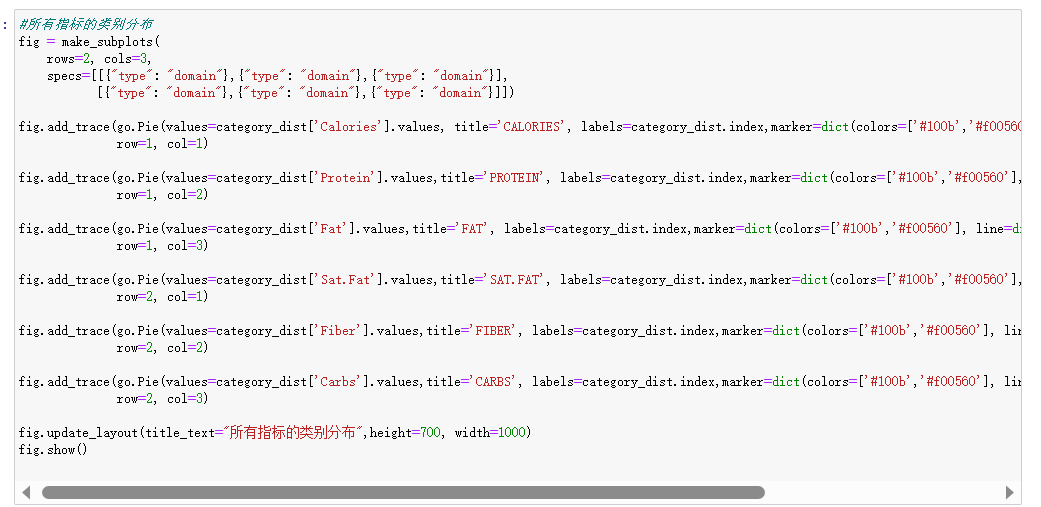
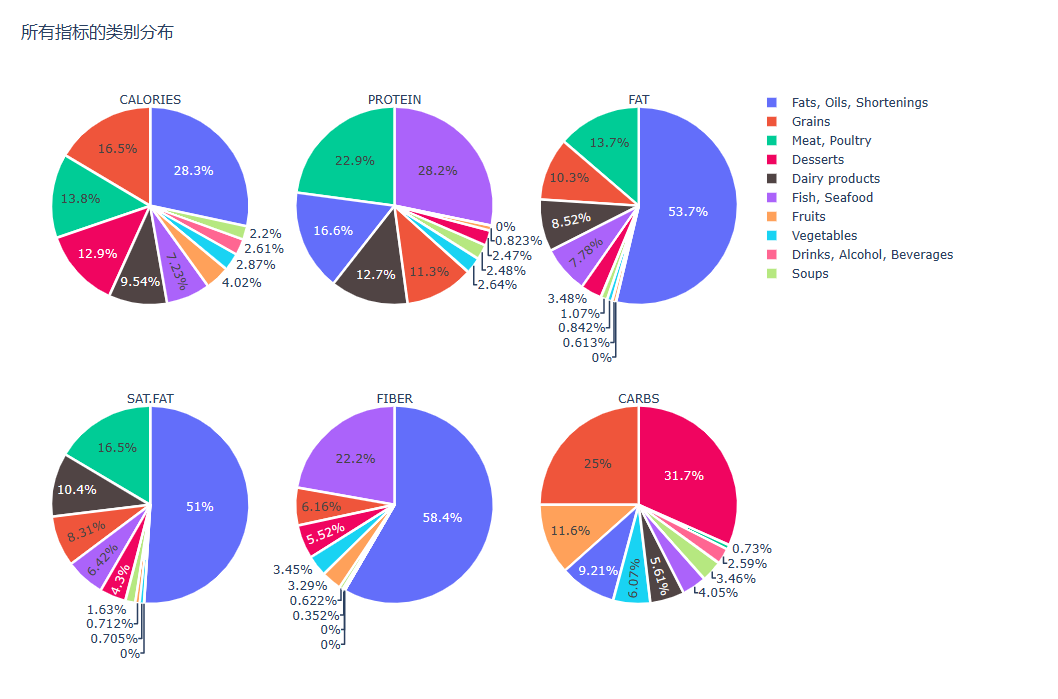
#所有指标的类别分布
fig = make_subplots(
rows=2, cols=3,
specs=[[{"type": "domain"},{"type": "domain"},{"type": "domain"}],
[{"type": "domain"},{"type": "domain"},{"type": "domain"}]])
fig.add_trace(go.Pie(values=category_dist['Calories'].values,title='CALORIES',labels=category_dist.index,marker=dict(colors=['#100b','#f00560'],line=dict(color='#FFFFFF',width=2.5))),row=1, col=1)
fig.add_trace(go.Pie(values=category_dist['Protein'].values,title='PROTEIN',labels=category_dist.index,marker=dict(colors=['#100b','#f00560'], line=dict(color='#FFFFFF',width=2.5))),row=1, col=2)
fig.add_trace(go.Pie(values=category_dist['Fat'].values,title='FAT',labels=category_dist.index,marker=dict(colors=['#100b','#f00560'], line=dict(color='#FFFFFF', width=2.5))),row=1, col=3)
fig.add_trace(go.Pie(values=category_dist['Sat.Fat'].values,title='SAT.FAT',labels=category_dist.index,marker=dict(colors=['#100b','#f00560'], line=dict(color='#FFFFFF', width=2.5))),row=2, col=1)
fig.add_trace(go.Pie(values=category_dist['Fiber'].values,title='FIBER',labels=category_dist.index,marker=dict(colors=['#100b','#f00560'], line=dict(color='#FFFFFF', width=2.5))),row=2, col=2)
fig.add_trace(go.Pie(values=category_dist['Carbs'].values,title='CARBS',labels=category_dist.index,marker=dict(colors=['#100b','#f00560'], line=dict(color='#FFFFFF', width=2.5))),row=2, col=3)
fig.update_layout(title_text="所有指标的类别分布",height=700, width=1000)
fig.show()
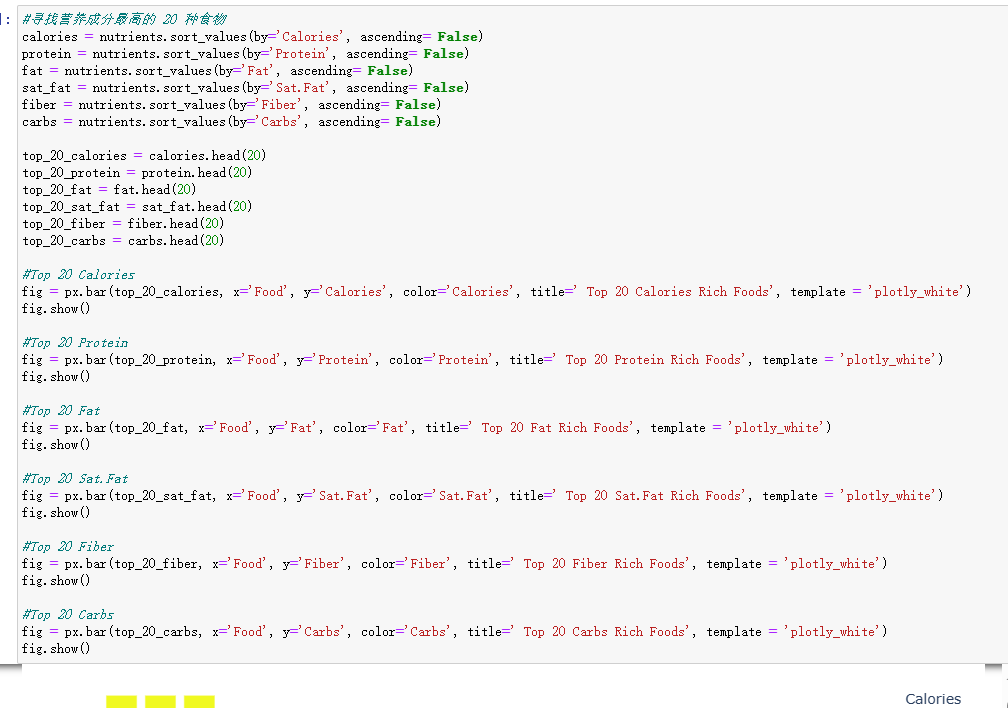
#寻找营养成分最高的 20 种食物
calories = nutrients.sort_values(by='Calories', ascending= False)
protein = nutrients.sort_values(by='Protein', ascending= False)
fat = nutrients.sort_values(by='Fat', ascending= False)
sat_fat = nutrients.sort_values(by='Sat.Fat', ascending= False)
fiber = nutrients.sort_values(by='Fiber', ascending= False)
carbs = nutrients.sort_values(by='Carbs', ascending= False)
top_20_calories = calories.head(20)
top_20_protein = protein.head(20)
top_20_fat = fat.head(20)
top_20_sat_fat = sat_fat.head(20)
top_20_fiber = fiber.head(20)
top_20_carbs = carbs.head(20)
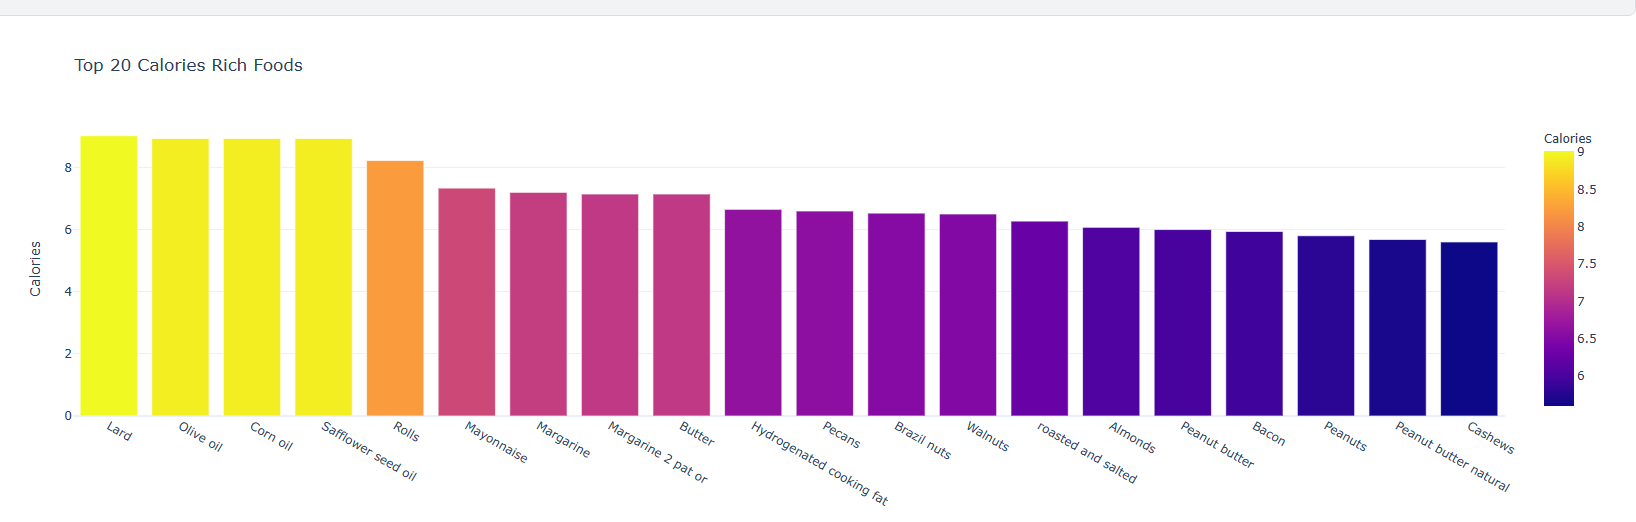
#Top 20 Calories
fig = px.bar(top_20_calories, x='Food', y='Calories', color='Calories', title=' Top 20 Calories Rich Foods', template = 'plotly_white')
fig.show()
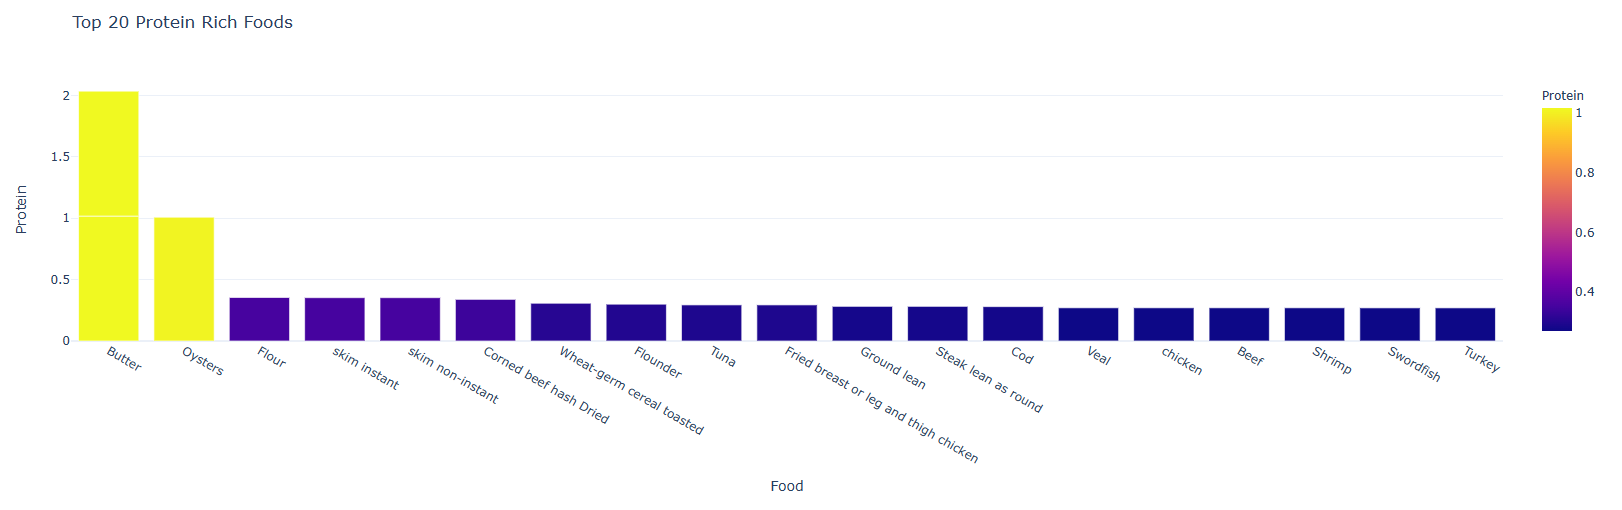
#Top 20 Protein
fig = px.bar(top_20_protein, x='Food', y='Protein', color='Protein', title=' Top 20 Protein Rich Foods', template = 'plotly_white')
fig.show()
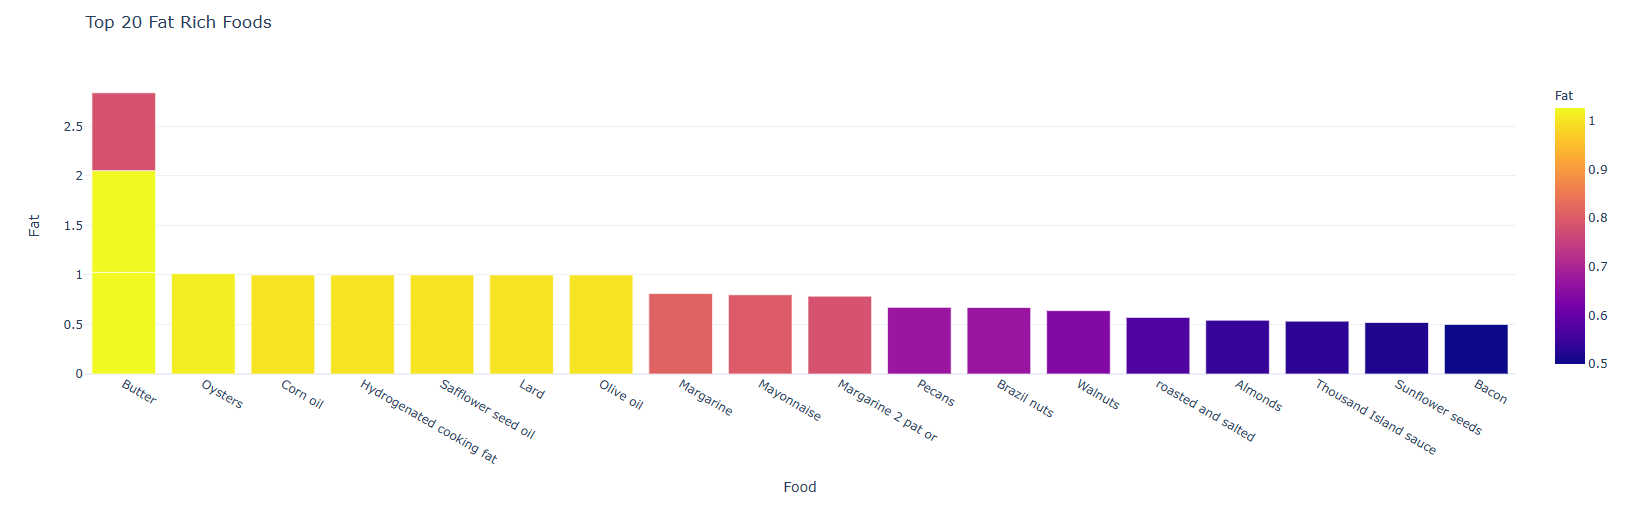
#Top 20 Fat
fig = px.bar(top_20_fat, x='Food', y='Fat', color='Fat', title=' Top 20 Fat Rich Foods', template = 'plotly_white')
fig.show()
#Top 20 Sat.Fat
fig = px.bar(top_20_sat_fat, x='Food', y='Sat.Fat', color='Sat.Fat', title=' Top 20 Sat.Fat Rich Foods', template = 'plotly_white')
fig.show()
#Top 20 Fiber
fig = px.bar(top_20_fiber, x='Food', y='Fiber', color='Fiber', title=' Top 20 Fiber Rich Foods', template = 'plotly_white')
fig.show()
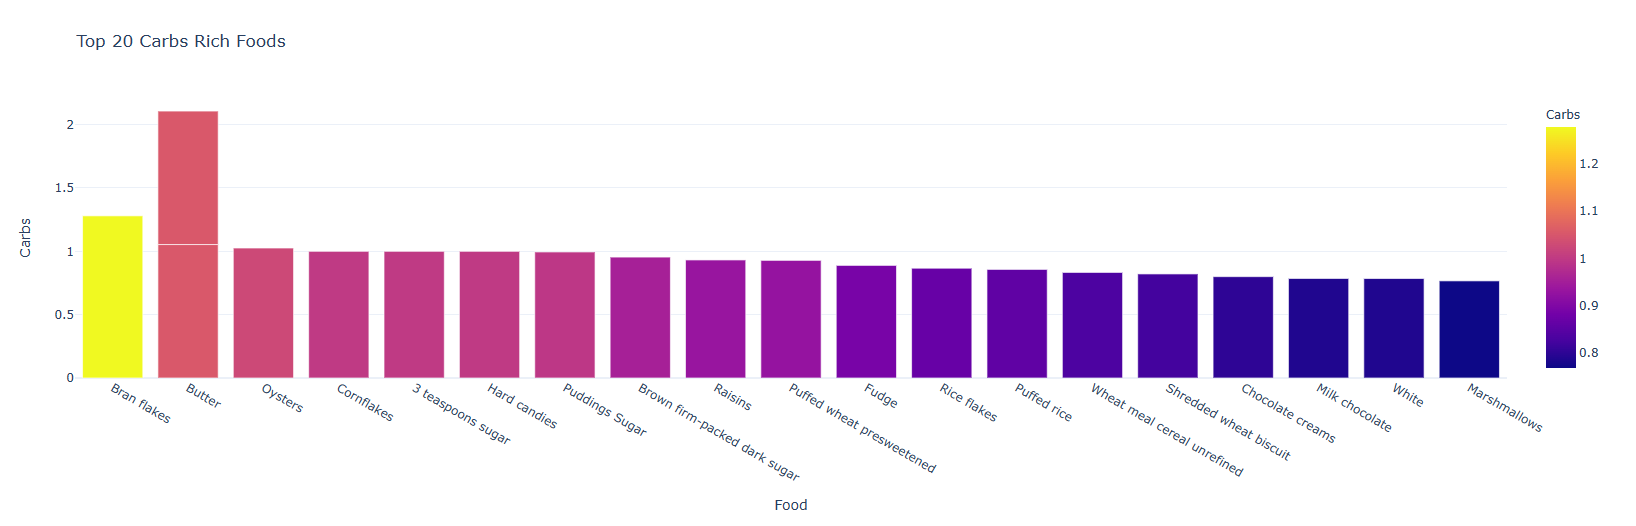
#Top 20 Carbs
fig = px.bar(top_20_carbs, x='Food', y='Carbs', color='Carbs', title=' Top 20 Carbs Rich Foods', template = 'plotly_white')
fig.show()


#脂肪和饱和脂肪之间的关系
fig = px.scatter(nutrients, x = 'Fat', y = 'Sat.Fat', trendline = 'lowess', color = 'Fat',color_discrete_map={'Fat':'#cd0000', 'Sat.Fat':'#3399ff'},hover_name='Food' ,template = 'plotly_white', title = '脂肪和饱和脂肪之间的关系')
fig.show()


#基于蛋白质含量的食物比较
Fig =go.Figure(go.Pie(values=category_dist['Protein'].values, text=category_dist.index, labels=category_dist.index,marker=dict(colors=['#100b','#f00560'], line=dict(color='#FFFFFF', width=2.5))))
fig.update_layout(title_text="基于蛋白质含量的食物比较",height=600, width=800)
fig.show()


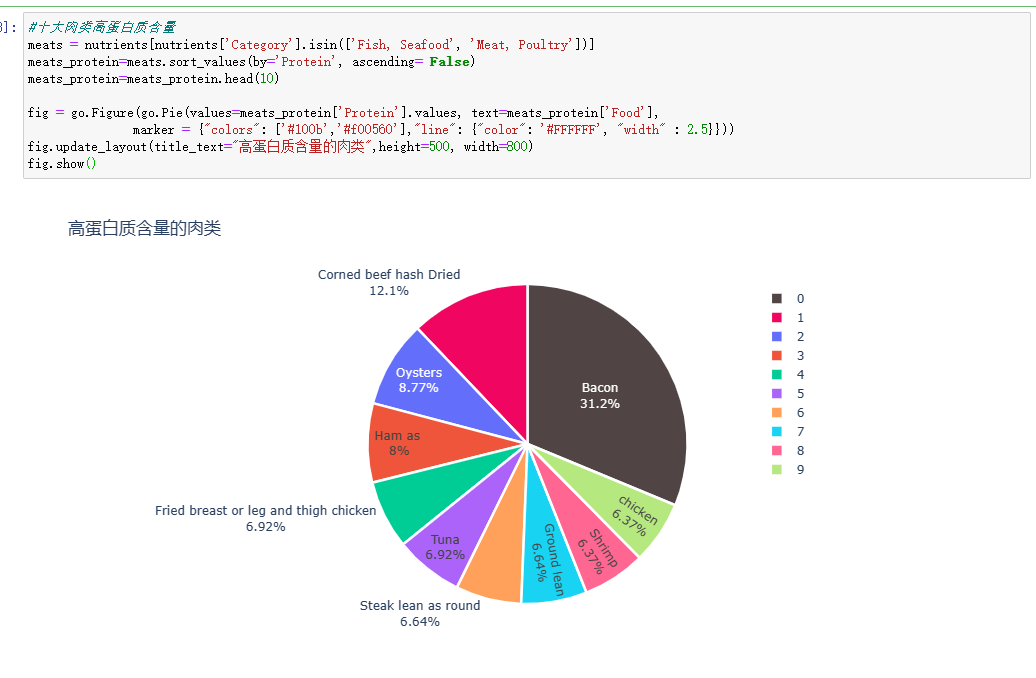
#十大肉类高蛋白质含量
meats = nutrients[nutrients['Category'].isin(['Fish, Seafood', 'Meat, Poultry'])]
meats_protein=meats.sort_values(by='Protein', ascending= False)
meats_protein=meats_protein.head(10)
fig = go.Figure(go.Pie(values=meats_protein['Protein'].values, text=meats_protein['Food'],marker = {"colors": ['#100b','#f00560'],"line": {"color": '#FFFFFF', "width" : 2.5}}))
fig.update_layout(title_text="高蛋白质含量的肉类",height=500, width=800)
fig.show()
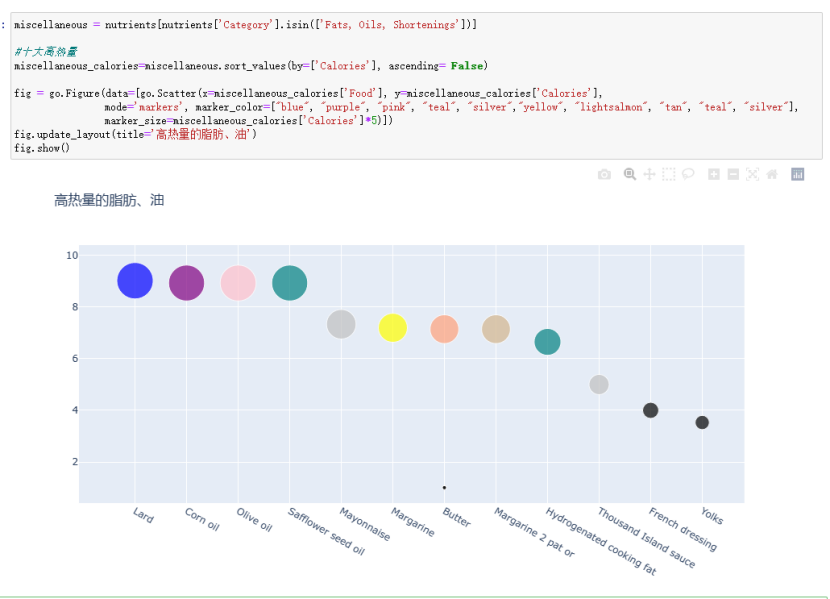
#十大高热量
miscellaneous_calories=miscellaneous.sort_values(by=['Calories'], ascending= False)
fig = go.Figure(data=[go.Scatter(x=miscellaneous_calories['Food'], y=miscellaneous_calories['Calories'],
mode='markers', marker_color=["blue", "purple", "pink", "teal", "silver","yellow", "lightsalmon", "tan", "teal", "silver"],
marker_size=miscellaneous_calories['Calories']*5)])
fig.update_layout(title='高热量的脂肪、油')
fig.show()
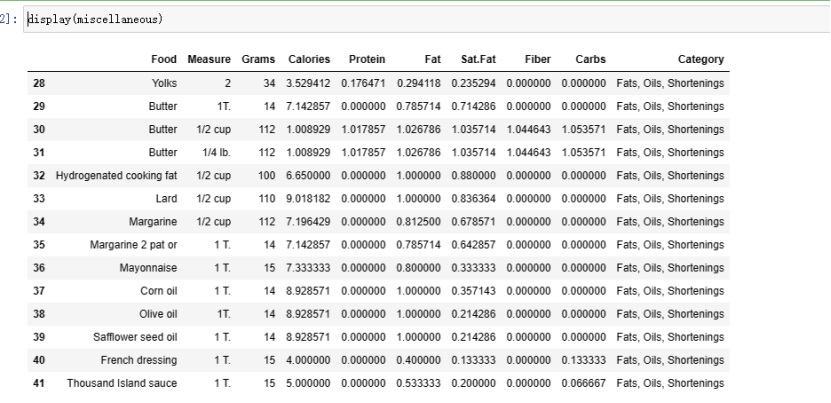
#展示高热量数据结果
display(miscellaneous)
4.总结
当今时代,人们越来越关注饮食的营养价值和成分。为了更好地理解食物的营养价值以及如何在饮食中平衡各种营养素的摄入,营养数据可视化成为一种重要的方式。常见的食物营养数据可视化包括热量、脂肪、蛋白质、碳水化合物、纤维素、维生素、矿物质等成分的含量图表。这些图表不仅可以帮助人们了解食物的营养价值,还能够帮助他们调整饮食,以满足身体的需要。通过关于各种食物的营养数据可视化,这使人们更容易地查找并比较食物的营养成分,从而更好地规划饮食。
通过学习数据分析,我有如下几点的感悟:
1. 数据和信息的区别:数据并不等同于信息,数据是零散的、未加工的,需要通过数据分析才能获得有价值的信息,才有实际意义。
2. 数据清洗很重要:在进行数据分析前,需要进行数据清洗,包括处理缺失值、处理异常值、数据类型转换等。一个好的数据清洗过程可以让后续的数据分析更加准确和高效。
3. 数据可视化让分析更直观:数据可视化可以让我们在分析数据时更加直观,从而更好地理解数据,发现数据中的规律、趋势和关联性。
4. 实践是学习的重要途径:在学习数据分析时,要多进行实践,结合实际问题,这样才能更好地掌握数据分析的方法和技能。
5. 学习过程中需要细心和耐心:进行数据分析的过程中需要细心和耐心,因为每一个环节都非常重要。一旦出现错误或疏忽,会导致后续的数据分析结果失真。
不足之处:
1. 学习过程中有时候理解起来比较困难,需要花费很多时间去理解概念和算法。
2. 数据分析涉及的知识面非常广,需要学习很多不同的技能和工具,需要花费大量的时间和精力。
3. 在进行数据分析过程中,有时候需要处理较大的数据集,而计算机的性能可能跟不上,导致分析效率比较低。
总之,通过数据分析的学习,可以更好地理解数据和信息之间的关系,从而为实际问题的决策提供更好的支持和建议。
全代码:
#导入库并定义用于绘制数据的函数
import pandas as pd
import plotly.express as px
from plotly.subplots import make_subplots
import plotly.graph_objects as go
#读取文档
nutrients=pd.read_csv("D:/文档/python高级应用/nutrients_csvfile.csv")
nutrients.head()
#数据中的 t用0代替。t表示食品中的微量
nutrients = nutrients.replace("t", 0)
nutrients = nutrients.replace("t'", 0)
nutrients.head()
#检查数据集的大小
display(nutrients)
#将逗号转换为相应 int 或浮点变量的数字数据
nutrients = nutrients.replace(",","", regex=True)
nutrients['Protein'] = nutrients['Protein'].replace("-1","", regex=True)
nutrients['Fiber'] = nutrients['Fiber'].replace("a","", regex=True)
nutrients['Calories'][91] = (8+44)/2
#将克、卡路里、蛋白质、脂肪、饱和脂肪、纤维和碳水化合物数据类型转换为 int
nutrients['Grams'] = pd.to_numeric(nutrients['Grams'])
nutrients['Calories'] = pd.to_numeric(nutrients['Calories'])
nutrients['Protein'] = pd.to_numeric(nutrients['Protein'])
nutrients['Fat'] = pd.to_numeric(nutrients['Fat'])
nutrients['Sat.Fat'] = pd.to_numeric(nutrients['Sat.Fat'])
nutrients['Fiber'] = pd.to_numeric(nutrients['Fiber'])
nutrients['Carbs'] = pd.to_numeric(nutrients['Carbs'])
#检查数据类型改变的结果
nutrients.dtypes
#检查数据质量
print(nutrients.isnull().any())
print('-'*245)
print(nutrients.describe())
print('-'*245)
#空值清除
nutrients = nutrients.dropna()
display(nutrients)
#简化类别
nutrients['Category'] = nutrients['Category'].replace('DrinksAlcohol Beverages', 'Drinks, Alcohol, Beverages', regex=True)
nutrients['Category'] = nutrients['Category'].replace('Fats Oils Shortenings', 'Fats, Oils, Shortenings', regex=True)
nutrients['Category'] = nutrients['Category'].replace('Fish Seafood', 'Fish, Seafood', regex=True)
nutrients['Category'] = nutrients['Category'].replace('Meat Poultry', 'Meat, Poultry', regex=True)
nutrients['Category'] = nutrients['Category'].replace(['Breads cereals fastfoodgrains', 'Seeds and Nuts'], 'Grains', regex=True)
nutrients['Category'] = nutrients['Category'].replace(['Desserts sweets', 'Jams Jellies'], 'Desserts', regex=True)
nutrients['Category'] = nutrients['Category'].replace(['Fruits A-F', 'Fruits G-P', 'Fruits R-Z'], 'Fruits', regex=True)
nutrients['Category'] = nutrients['Category'].replace(['Vegetables A-E', 'Vegetables F-P', 'Vegetables R-Z'], 'Vegetables', regex=True)
#将克、卡路里、蛋白质、脂肪、饱和脂肪、纤维和碳水化合物值转换为每克
nutrients['Calories'] = nutrients['Calories'] / nutrients['Grams']
nutrients['Protein'] = nutrients['Protein'] / nutrients['Grams']
nutrients['Fat'] = nutrients['Fat'] / nutrients['Grams']
nutrients['Sat.Fat'] = nutrients['Sat.Fat'] / nutrients['Grams']
nutrients['Fiber'] = nutrients['Fiber'] / nutrients['Grams']
nutrients['Carbs'] = nutrients['Carbs'] / nutrients['Grams']
#检查最终的数据结果
category_dist = nutrients.groupby(['Category']).mean()
category_dist
#所有指标的类别分布
fig = make_subplots(
rows=2, cols=3,
specs=[[{"type": "domain"},{"type": "domain"},{"type": "domain"}],
[{"type": "domain"},{"type": "domain"},{"type": "domain"}]])
fig.add_trace(go.Pie(values=category_dist['Calories'].values,title='CALORIES',labels=category_dist.index,marker=dict(colors=['#100b','#f00560'],line=dict(color='#FFFFFF',width=2.5))),row=1, col=1)
fig.add_trace(go.Pie(values=category_dist['Protein'].values,title='PROTEIN',labels=category_dist.index,marker=dict(colors=['#100b','#f00560'], line=dict(color='#FFFFFF',width=2.5))),row=1, col=2)
fig.add_trace(go.Pie(values=category_dist['Fat'].values,title='FAT',labels=category_dist.index,marker=dict(colors=['#100b','#f00560'], line=dict(color='#FFFFFF', width=2.5))),row=1, col=3)
fig.add_trace(go.Pie(values=category_dist['Sat.Fat'].values,title='SAT.FAT',labels=category_dist.index,marker=dict(colors=['#100b','#f00560'], line=dict(color='#FFFFFF', width=2.5))),row=2, col=1)
fig.add_trace(go.Pie(values=category_dist['Fiber'].values,title='FIBER',labels=category_dist.index,marker=dict(colors=['#100b','#f00560'], line=dict(color='#FFFFFF', width=2.5))),row=2, col=2)
fig.add_trace(go.Pie(values=category_dist['Carbs'].values,title='CARBS',labels=category_dist.index,marker=dict(colors=['#100b','#f00560'], line=dict(color='#FFFFFF', width=2.5))),row=2, col=3)
fig.update_layout(title_text="所有指标的类别分布",height=700, width=1000)
fig.show()
#寻找营养成分最高的 20 种食物
calories = nutrients.sort_values(by='Calories', ascending= False)
protein = nutrients.sort_values(by='Protein', ascending= False)
fat = nutrients.sort_values(by='Fat', ascending= False)
sat_fat = nutrients.sort_values(by='Sat.Fat', ascending= False)
fiber = nutrients.sort_values(by='Fiber', ascending= False)
carbs = nutrients.sort_values(by='Carbs', ascending= False)
top_20_calories = calories.head(20)
top_20_protein = protein.head(20)
top_20_fat = fat.head(20)
top_20_sat_fat = sat_fat.head(20)
top_20_fiber = fiber.head(20)
top_20_carbs = carbs.head(20)
#Top 20 Calories
fig = px.bar(top_20_calories, x='Food', y='Calories', color='Calories', title=' Top 20 Calories Rich Foods', template = 'plotly_white')
fig.show()
#Top 20 Protein
fig = px.bar(top_20_protein, x='Food', y='Protein', color='Protein', title=' Top 20 Protein Rich Foods', template = 'plotly_white')
fig.show()
#Top 20 Fat
fig = px.bar(top_20_fat, x='Food', y='Fat', color='Fat', title=' Top 20 Fat Rich Foods', template = 'plotly_white')
fig.show()
#Top 20 Sat.Fat
fig = px.bar(top_20_sat_fat, x='Food', y='Sat.Fat', color='Sat.Fat', title=' Top 20 Sat.Fat Rich Foods', template = 'plotly_white')
fig.show()
#Top 20 Fiber
fig = px.bar(top_20_fiber, x='Food', y='Fiber', color='Fiber', title=' Top 20 Fiber Rich Foods', template = 'plotly_white')
fig.show()
#Top 20 Carbs
fig = px.bar(top_20_carbs, x='Food', y='Carbs', color='Carbs', title=' Top 20 Carbs Rich Foods', template = 'plotly_white')
fig.show()
#脂肪和饱和脂肪之间的关系
fig = px.scatter(nutrients, x = 'Fat', y = 'Sat.Fat', trendline = 'lowess', color = 'Fat',color_discrete_map={'Fat':'#cd0000', 'Sat.Fat':'#3399ff'},hover_name='Food' ,template = 'plotly_white', title = '脂肪和饱和脂肪之间的关系')
fig.show()
#基于蛋白质含量的食物比较
Fig =go.Figure(go.Pie(values=category_dist['Protein'].values, text=category_dist.index, labels=category_dist.index,marker=dict(colors=['#100b','#f00560'], line=dict(color='#FFFFFF', width=2.5))))
fig.update_layout(title_text="基于蛋白质含量的食物比较",height=600, width=800)
fig.show()
#十大肉类高蛋白质含量
meats = nutrients[nutrients['Category'].isin(['Fish, Seafood', 'Meat, Poultry'])]
meats_protein=meats.sort_values(by='Protein', ascending= False)
meats_protein=meats_protein.head(10)
fig = go.Figure(go.Pie(values=meats_protein['Protein'].values, text=meats_protein['Food'],marker = {"colors": ['#100b','#f00560'],"line": {"color": '#FFFFFF', "width" : 2.5}}))
fig.update_layout(title_text="高蛋白质含量的肉类",height=500, width=800)
fig.show()
#十大高热量
miscellaneous_calories=miscellaneous.sort_values(by=['Calories'], ascending= False)
fig = go.Figure(data=[go.Scatter(x=miscellaneous_calories['Food'], y=miscellaneous_calories['Calories'],
mode='markers', marker_color=["blue", "purple", "pink", "teal", "silver","yellow", "lightsalmon", "tan", "teal", "silver"],
marker_size=miscellaneous_calories['Calories']*5)])
fig.update_layout(title='高热量的脂肪、油')
fig.show()
#展示高热量数据结果
display(miscellaneous)