python 画向量图
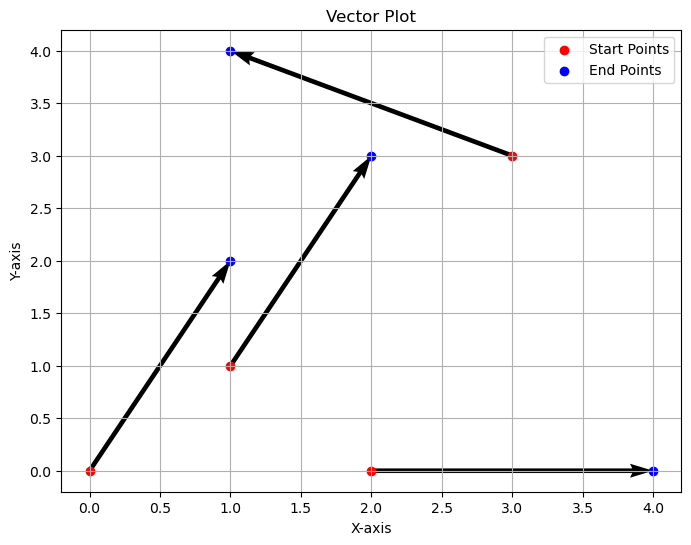
start_points 和 end_points 数组分别表示向量的起点和终点。
使用 plt.quiver 函数绘制向量(箭头)。
plt.scatter 用于绘制起点和终点(可选)。
plt.legend 添加图例。
plt.title、plt.xlabel 和 plt.ylabel 添加标题和轴标签。
plt.grid(True) 显示网格。
plt.show() 显示图像。
import numpy as np
import matplotlib.pyplot as plt

# 定义起点和终点坐标(向量)
start_points = np.array([[0, 0], [1, 1], [2, 0], [3, 3]])
end_points = np.array([[1, 2], [2, 3], [4, 0], [1, 4]])

# 绘制向量
plt.figure(figsize=(8, 6))

# 使用quiver绘制向量场(箭头)
# units='xy' 表示箭头的长度单位是数据坐标
# scale=1 是缩放因子,可以调整箭头的大小
plt.quiver(start_points[:, 0], start_points[:, 1],
           end_points[:, 0] - start_points[:, 0],
           end_points[:, 1] - start_points[:, 1],
           units='xy', scale=1, angles='xy', scale_units='xy')

# 绘制起点(可选)
plt.scatter(start_points[:, 0], start_points[:, 1], color='red', label='Start Points')

# 绘制终点(可选)
plt.scatter(end_points[:, 0], end_points[:, 1], color='blue', label='End Points')

# 添加图例
plt.legend()

# 添加标题和标签
plt.title('Vector Plot')
plt.xlabel('X-axis')
plt.ylabel('Y-axis')

# 显示网格
plt.grid(True)

# 显示图像
plt.show()