python相平面 图形
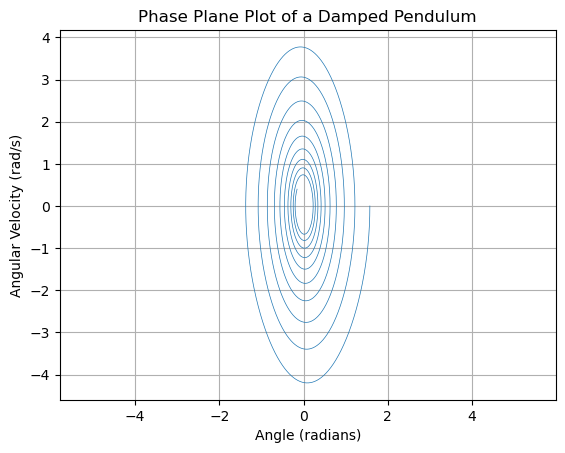
二阶非线性自治系统绘制相平面图。假设我们有一个简单的阻尼摆系统,其状态方程可以表示为:
\[
dx1/dt = x2 \\
dx2/dt = -cx2 - gsin(x1)
\]
import numpy as np
import matplotlib.pyplot as plt
from scipy.integrate import odeint

# 定义系统的状态方程
def pendulum_eqs(state, t, c, g):
    x1, x2 = state
    dx1dt = x2
    dx2dt = -c * x2 - g * np.sin(x1)
    return [dx1dt, dx2dt]

# 参数设置
c = 0.2  # 阻尼系数
g = 9.81 # 重力加速度

# 初始条件
initial_state = [np.pi/2, 0]  # 初始角度为π/2,初始速度为0

# 时间设置
t = np.linspace(0, 20, 10000)  # 从0到20秒,共10000个点

# 使用odeint进行数值积分
solution = odeint(pendulum_eqs, initial_state, t, args=(c, g))
x1, x2 = solution.T

# 绘制相平面图
plt.figure()
plt.plot(x1, x2, lw=0.5)
plt.xlabel('Angle (radians)')
plt.ylabel('Angular Velocity (rad/s)')
plt.title('Phase Plane Plot of a Damped Pendulum')
plt.grid(True)
plt.axis('equal')
plt.show()