1.代码
%matplotlib widget
import pandas as pd
import numpy as np
import matplotlib as mpl
from scipy.spatial import Delaunay
from sklearn.cluster import KMeans
import matplotlib.pyplot as plt
from mpl_toolkits.mplot3d import Axes3D
from scipy.spatial import ConvexHull
from sklearn.cluster import DBSCAN
from sklearn.preprocessing import StandardScaler

fig = plt.figure()
ax = Axes3D(fig,auto_add_to_figure=False)
fig.add_axes(ax)
color = ['red', 'pink', 'orange', 'blue', 'green', 'yellow', 'cyan', 'magenta', 'gray']

def To_Legend(n_clusters):
    y_unique = range(n_clusters)
    methods = ('Genre1', 'Genre2', 'Genre3', 'Genre4', 'Genre5', 'Genre6', 'Genre7', 'Genre8',
               'Genre9', 'Genre10', 'Genre11', 'Genre12', 'Genre13', 'Genre14')  # 图例说明集
    legend_lines = [mpl.lines.Line2D([0], [0], linestyle="none", marker='o', c=color[y]) for y in y_unique]
    legend_labels = [methods[y] for y in y_unique]
    ax.legend(legend_lines, legend_labels, numpoints=1, title='Cluster results')

def To_Execl(n_clusters, s):
    for i in range(n_clusters):
        ned = hull_points[labels == i, :]
        result = []
        for sub_list in ned:
            lst = str(sub_list[:])
            lst = lst.lstrip('[')
            lst = lst.rstrip(' ]')
            lst = lst.split()
            res = []
            for num in lst:
                res.append(float(num))
            result.append(res)
        df = pd.DataFrame(result)
        writer = pd.ExcelWriter(s[i])
        df.to_excel(writer)
        writer.save()

data = pd.read_excel("pointcloud.xlsx")
points = data.to_numpy()

tri = Delaunay(points)

normals = []
for sim_tri in tri.simplices:
    p1, p2, p3 = points[sim_tri[:3]]
    v1, v2 = p2-p1, p3-p1
    n = np.cross(v1, v2)
    normals.append(n)
normals = np.array(normals)

n_clusters = 3 # 这个参数是笔者手调的,也可以用auto-kmeans,让模型自适应
kmeans = KMeans(n_clusters=n_clusters, init="k-means++").fit(normals)
labels = kmeans.labels_

tri_ids = [[] for i in range(n_clusters)]
for i, label in enumerate(labels):
    tri_ids[label].append(i)

hull_points = []
j = 0
e = 0
for cluster in tri_ids:
    j += 1
    points_in_cluster = points[tri.simplices[cluster]]
    result = []
    for sub_list in points_in_cluster:
        for ssub in sub_list:
            lst = str(ssub)
            lst = lst.lstrip('[')
            lst = lst.rstrip(']')
            lst = lst.strip().split()
            res = []
            for num in lst:
                res.append(float(num))
            result.append(res)
    if result is not None:
        hull = ConvexHull(result, qhull_options="Qs")
        for i in hull.vertices:
            hull_points.append(result[int(i)])

hull_points = StandardScaler().fit_transform(hull_points)
hull_points = np.array(hull_points)
db = DBSCAN(eps=0.26).fit(hull_points) # 0.26是超参数,手调,笔者还没研究,可以向几何重心于模型边缘距离关系方向研究试试
core_samples_mask = np.zeros_like(db.labels_, dtype=bool)
core_samples_mask[db.core_sample_indices_] = True
labels = db.labels_
core_indices = db.core_sample_indices_
centroid = hull_points[core_indices]
n_clusters = len(set(db.labels_)) - (1 if -1 in db.labels_ else 0)

s = []
for i in range(n_clusters):
    s.append('D:\\Computer\\Algorithm\\Pycharm\\MathTest\\Data\\data{}.xlsx'.format(i + 1)) # 设为要保存的数据集地址
To_Execl(n_clusters, s)

for i in range(n_clusters):
    ax.scatter(hull_points[labels == i, 0], hull_points[labels == i, 1], hull_points[labels == i, 2], c=color[i])
To_Legend(n_clusters)
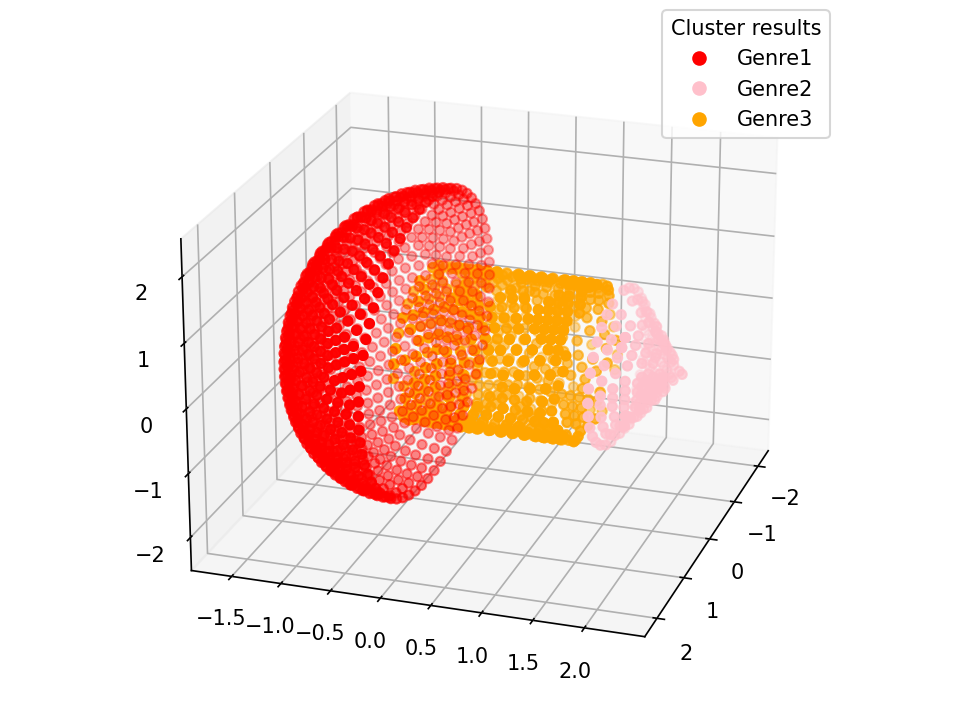
2.展示效果