phpstorm开启debug断点调试模式
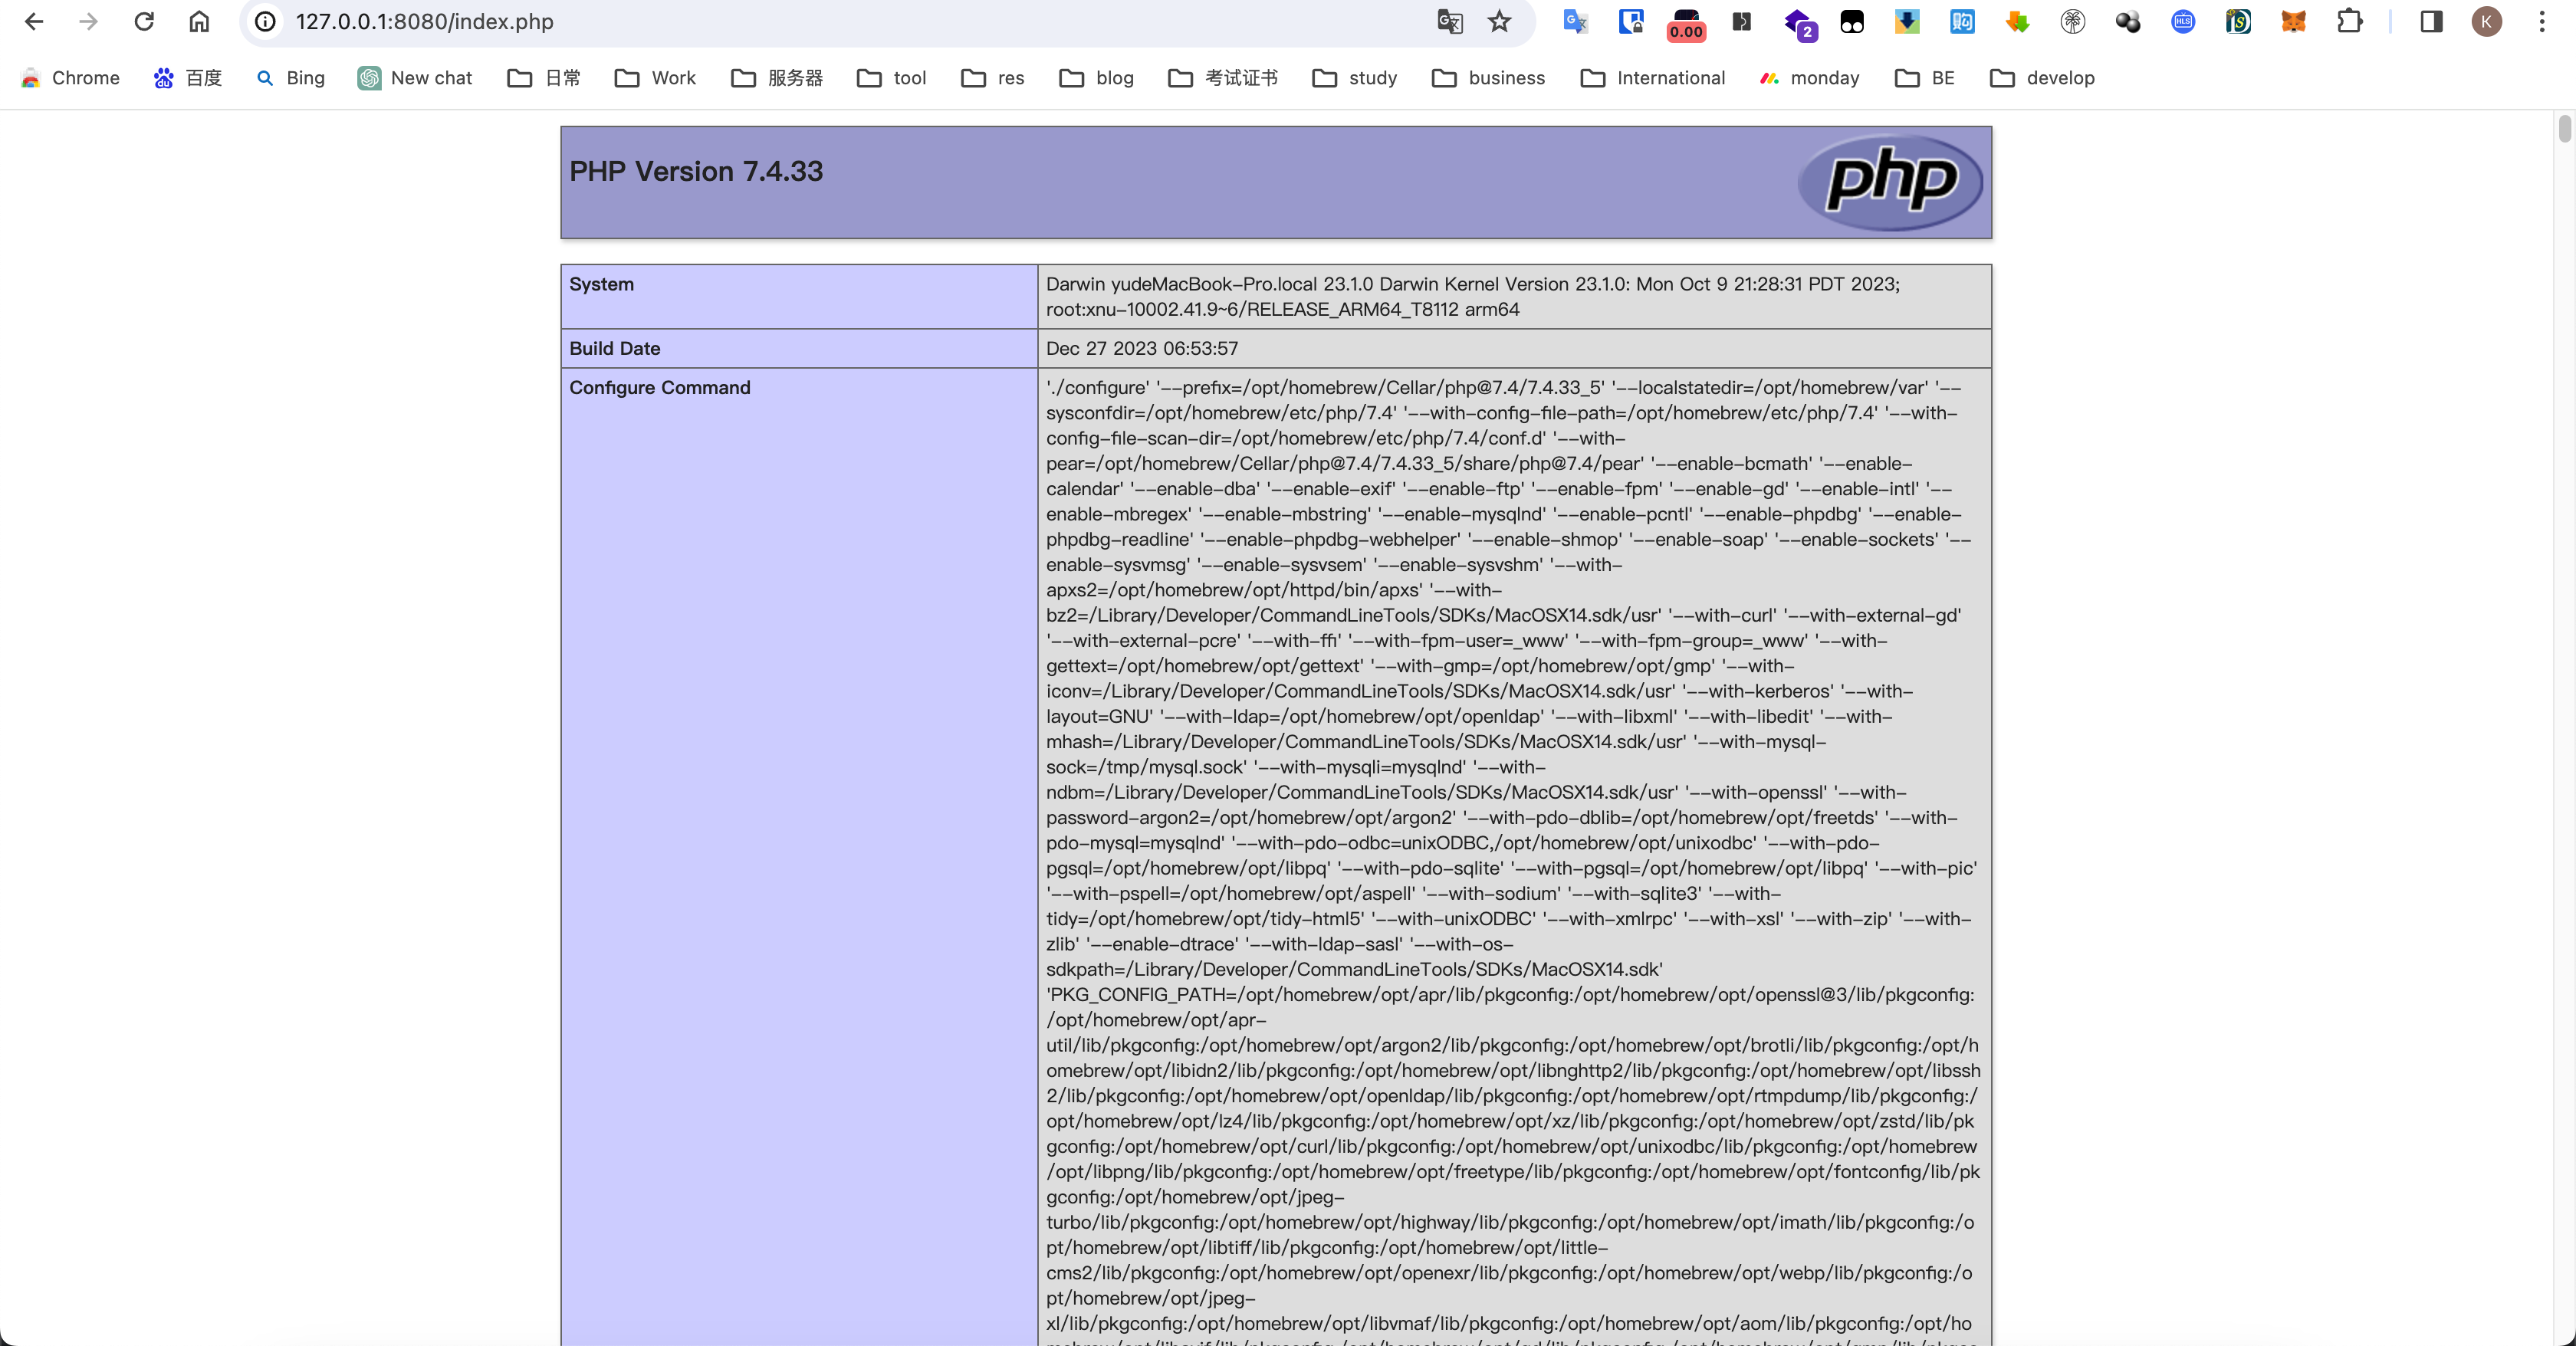
查看php版本
查看自己php的版本,使用:phpinfo() 函数
<?php
echo phpinfo();
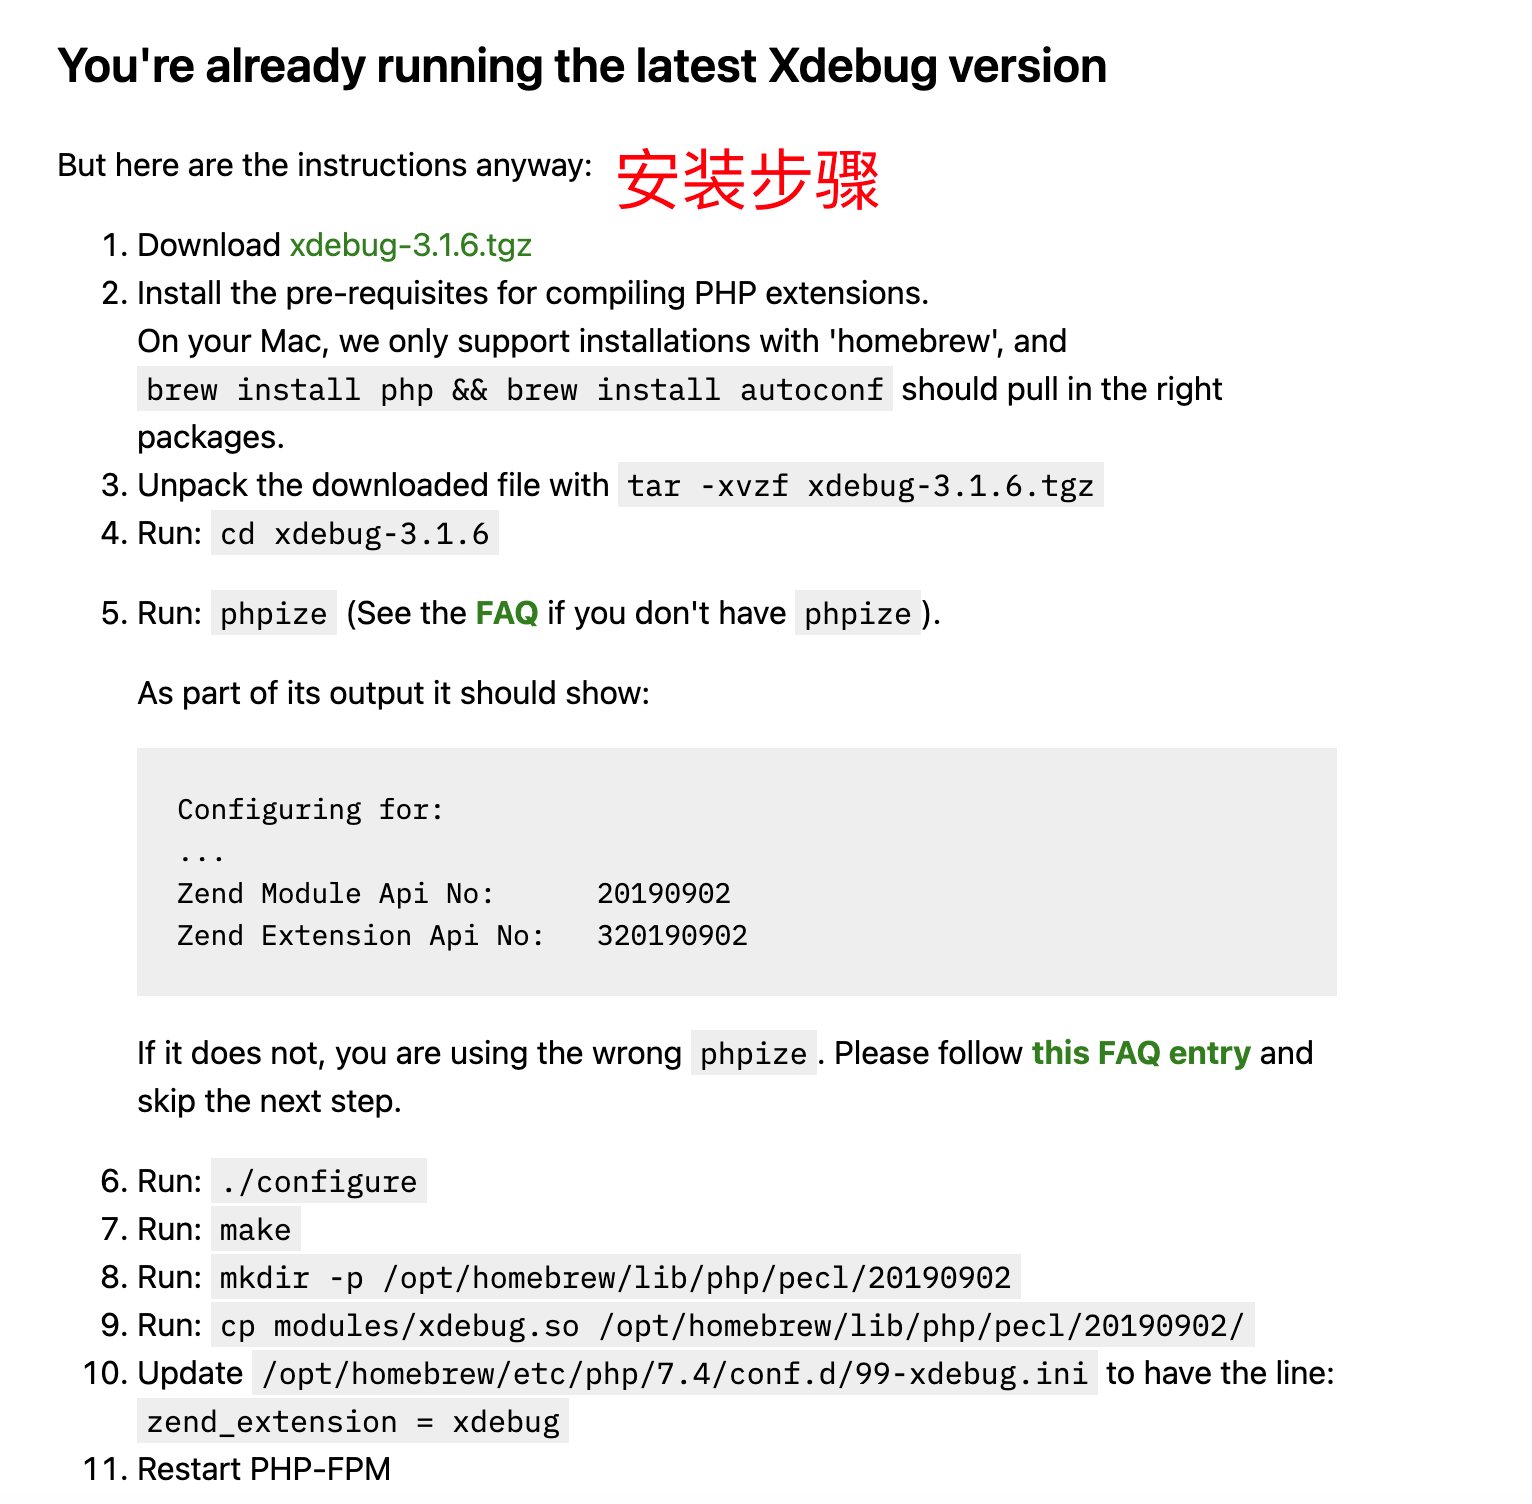
Xdebug
Xdebug: Support — Tailored Installation Instructions
右击查看index.php源代码
并复制到Xdebug中
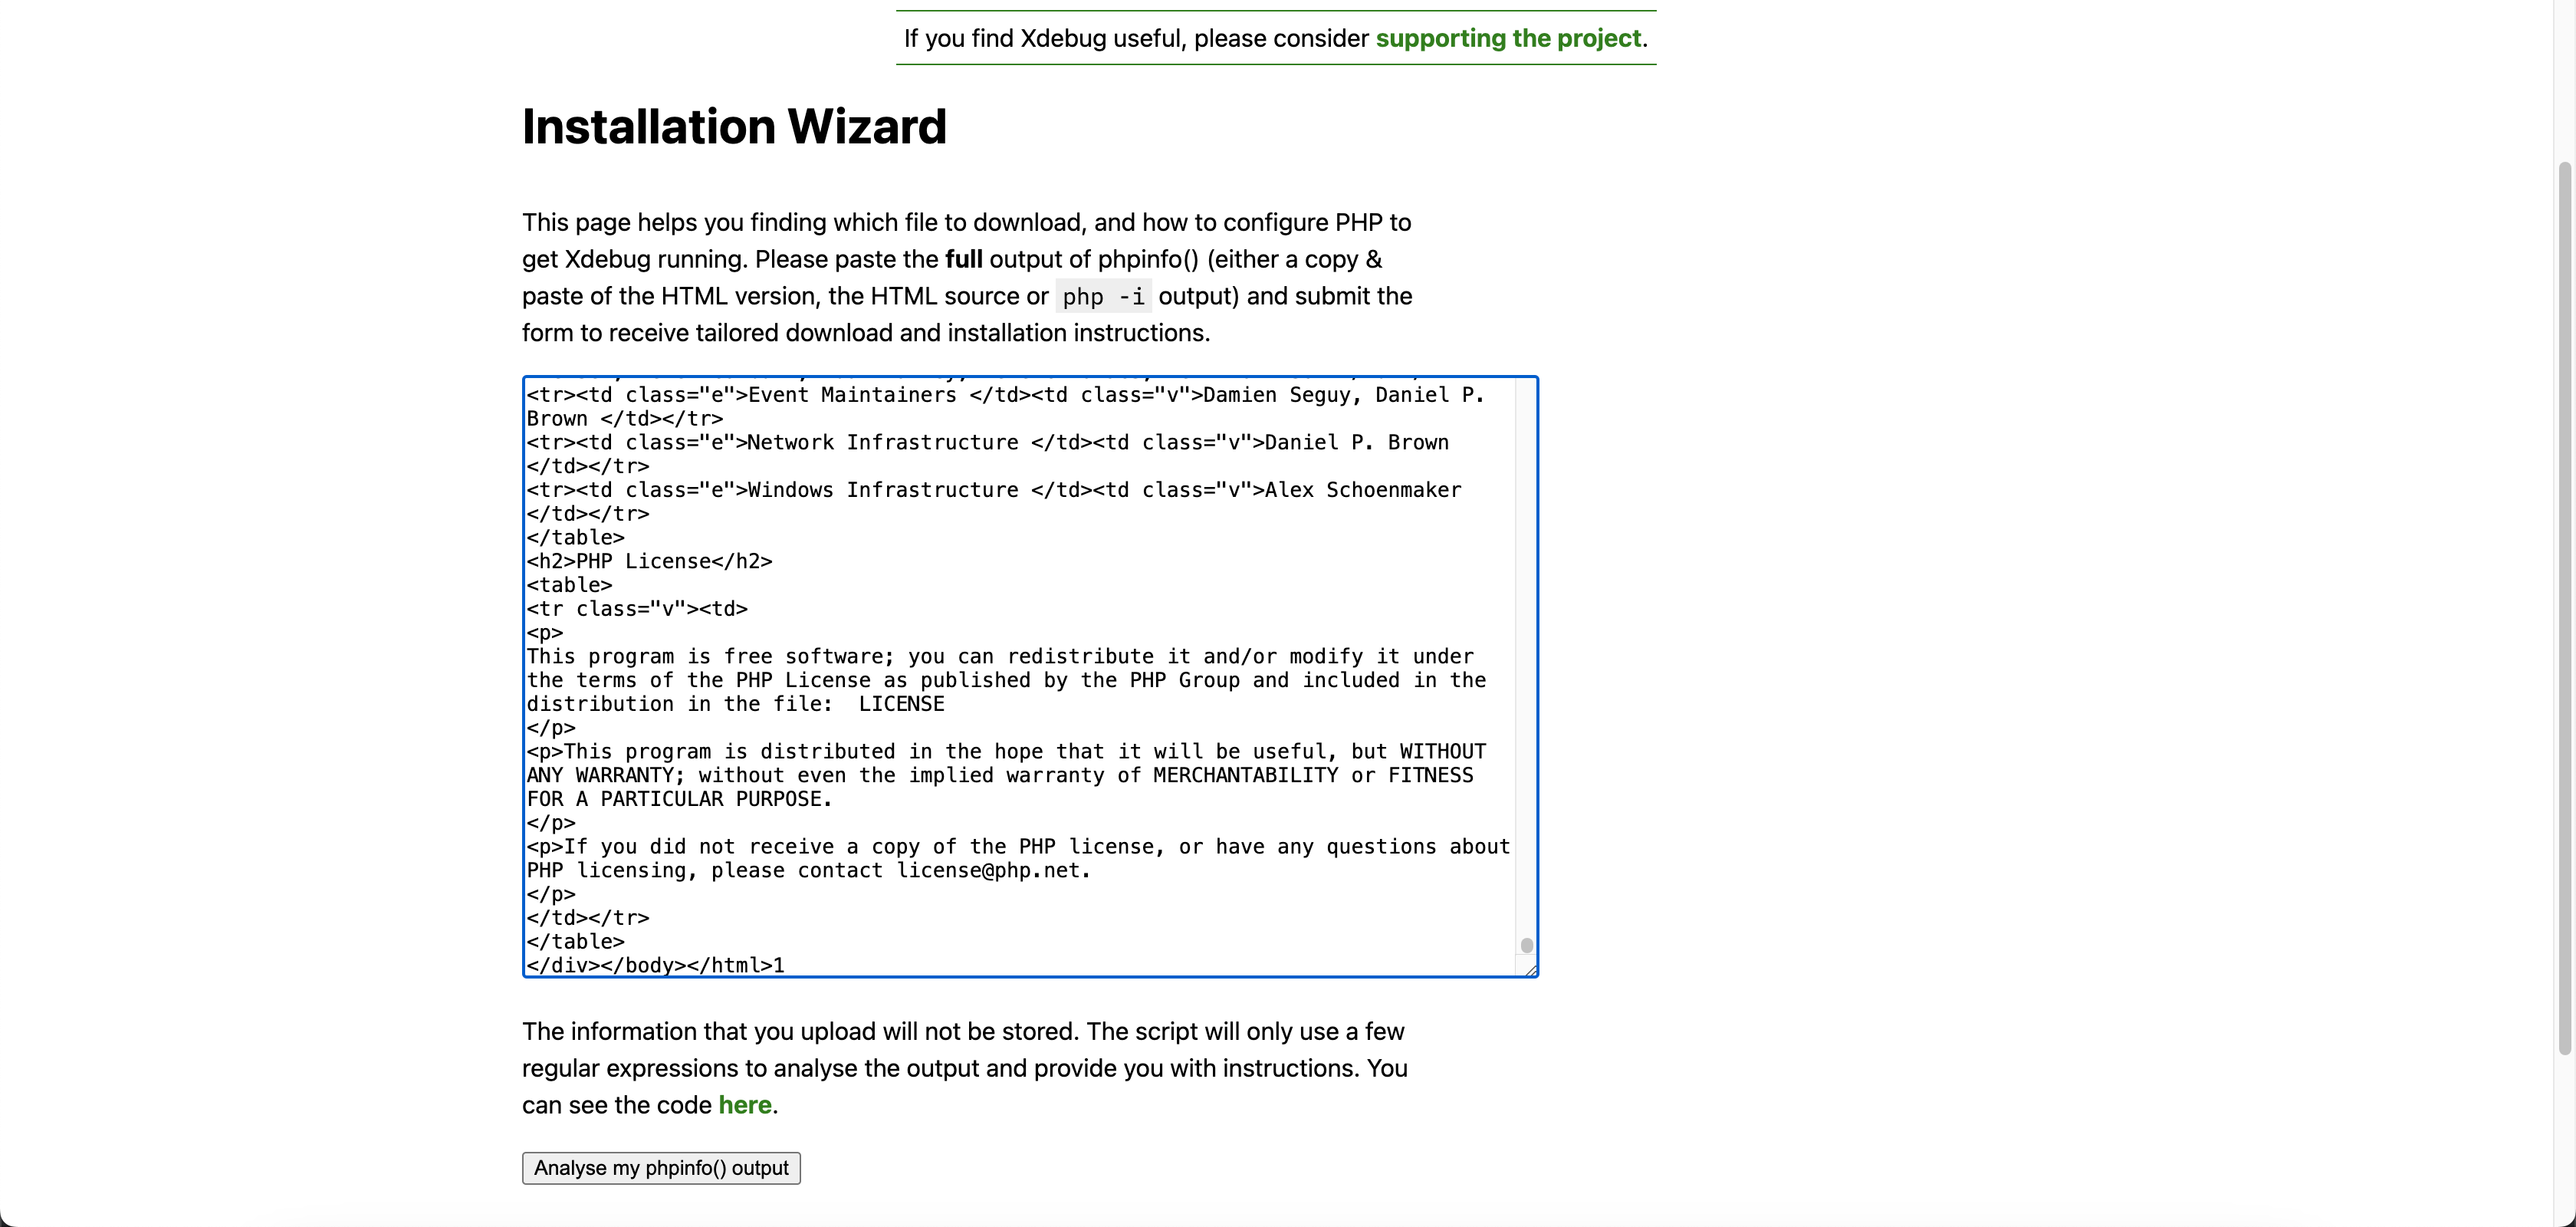
点击分析查看分析结果
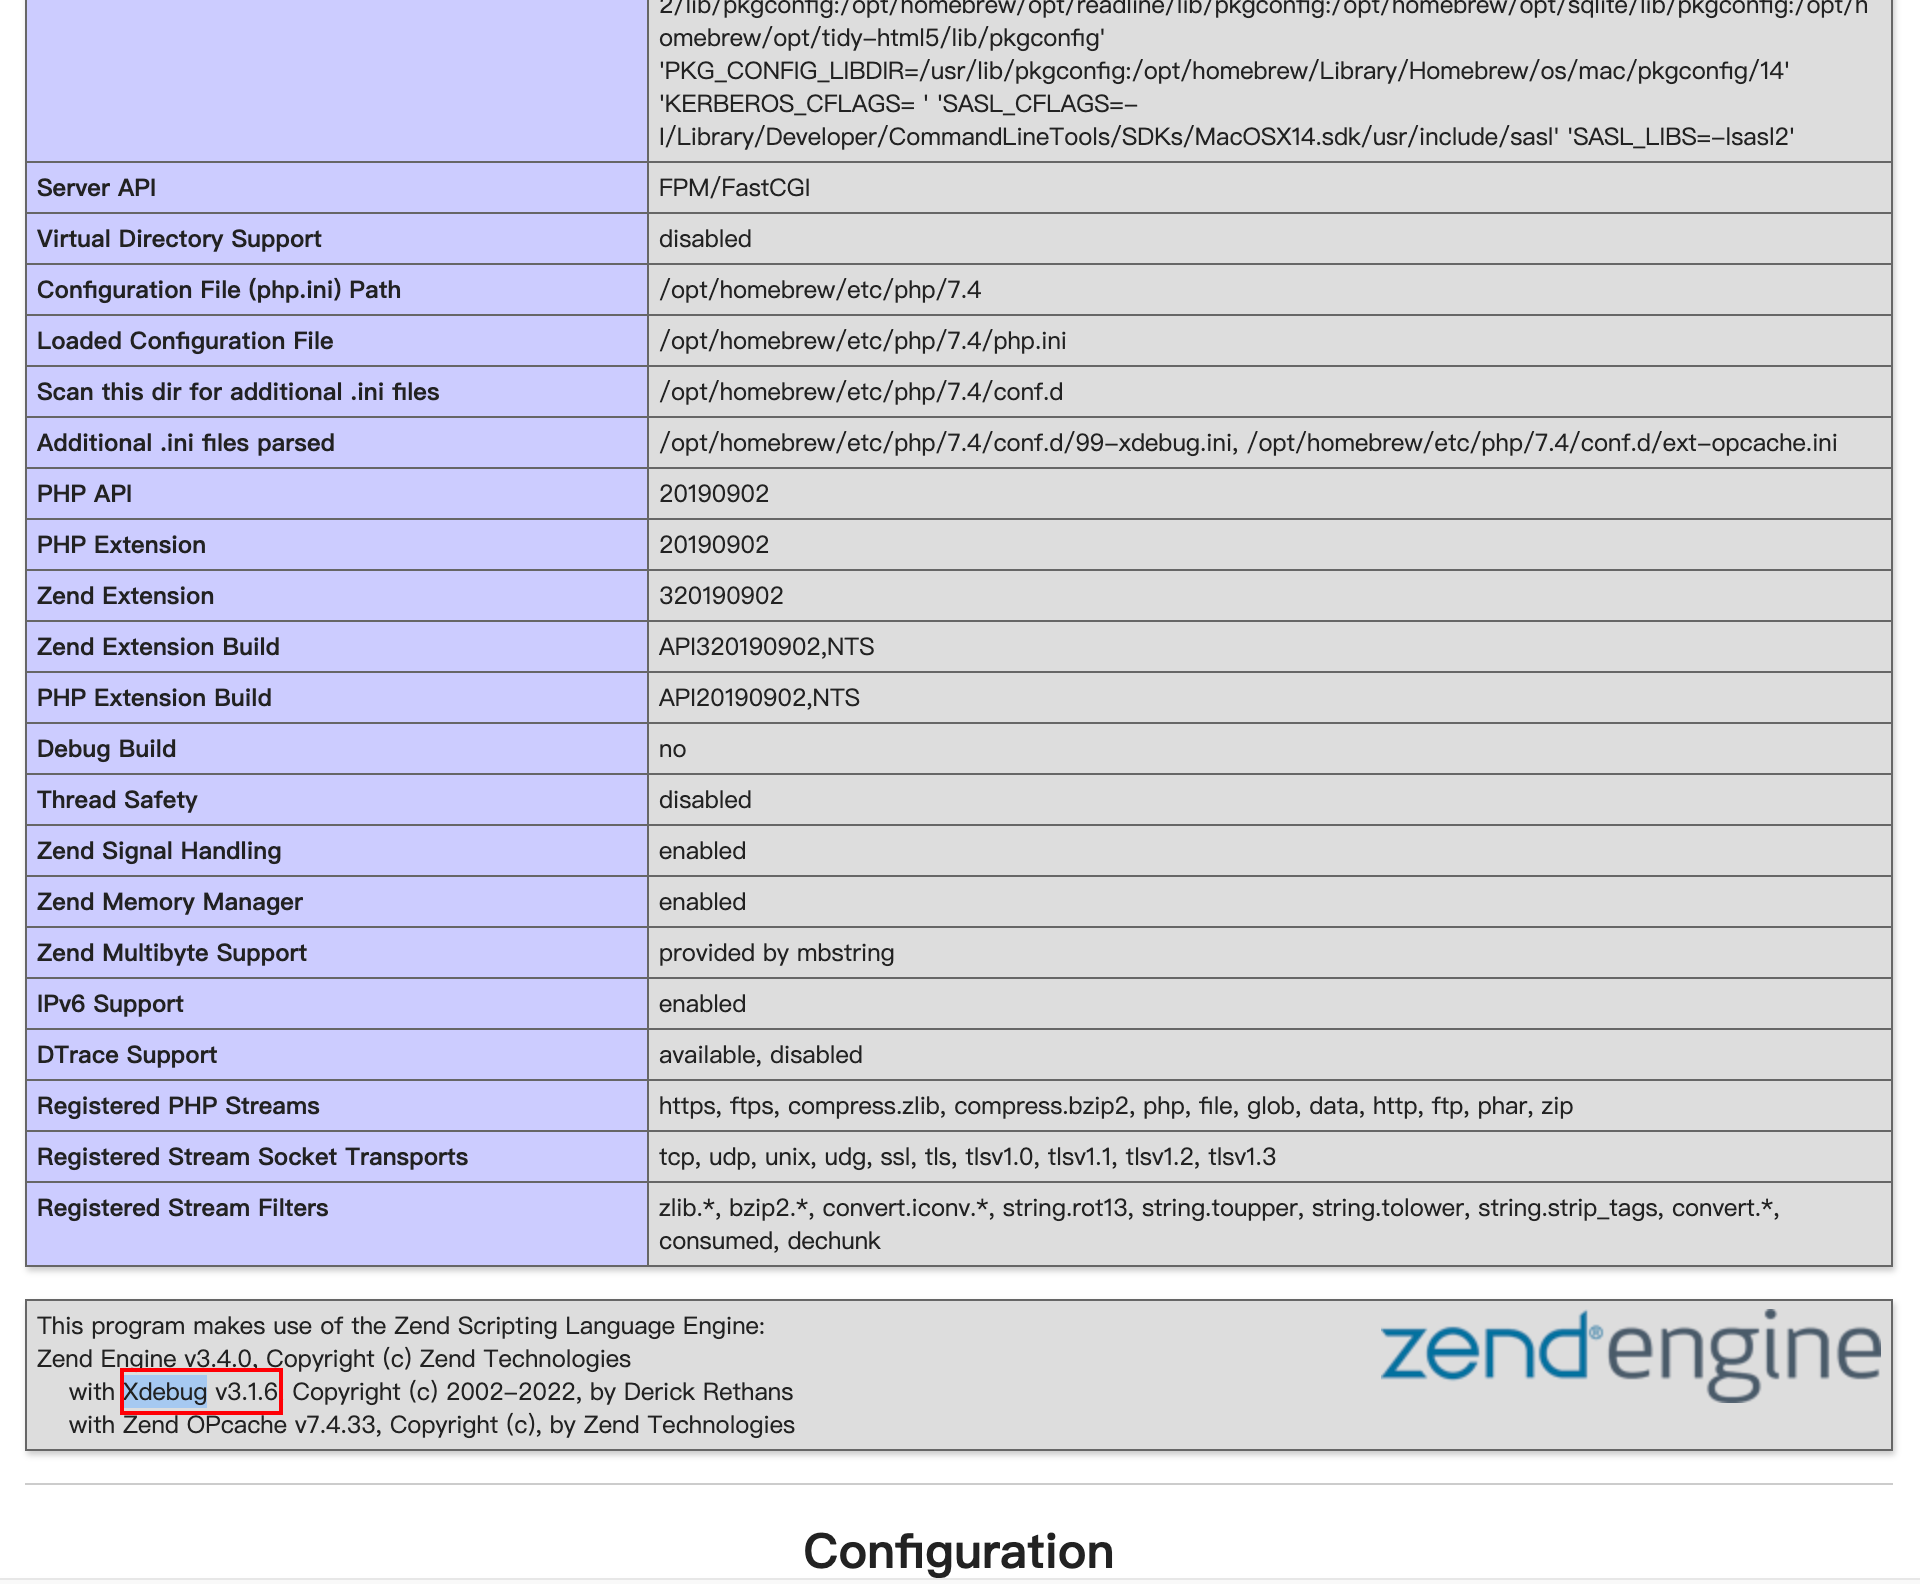
修改php配置文件
vi /opt/homebrew/etc/php/7.4/php.ini
#安装完Xdebug自带
zend_extension = xdebug
#添加部分
xdebug.mode=debug
xdebug.remote_enable = On
xdebug.remote_handler = "dbgp"
xdebug.remote_host = "localhost"
xdebug.remote_mode = "req"
xdebug.remote_port = 9000
xdebug.idekey = "PHPSTORM"
重启php-fpm
直接重启php环境,php-fpm也会一起重启,在刷新一下php网站的环境信息,里面就会有xdebug的描述,即配置成功
#重启php
brew services restart php@7.4
webstorm配置
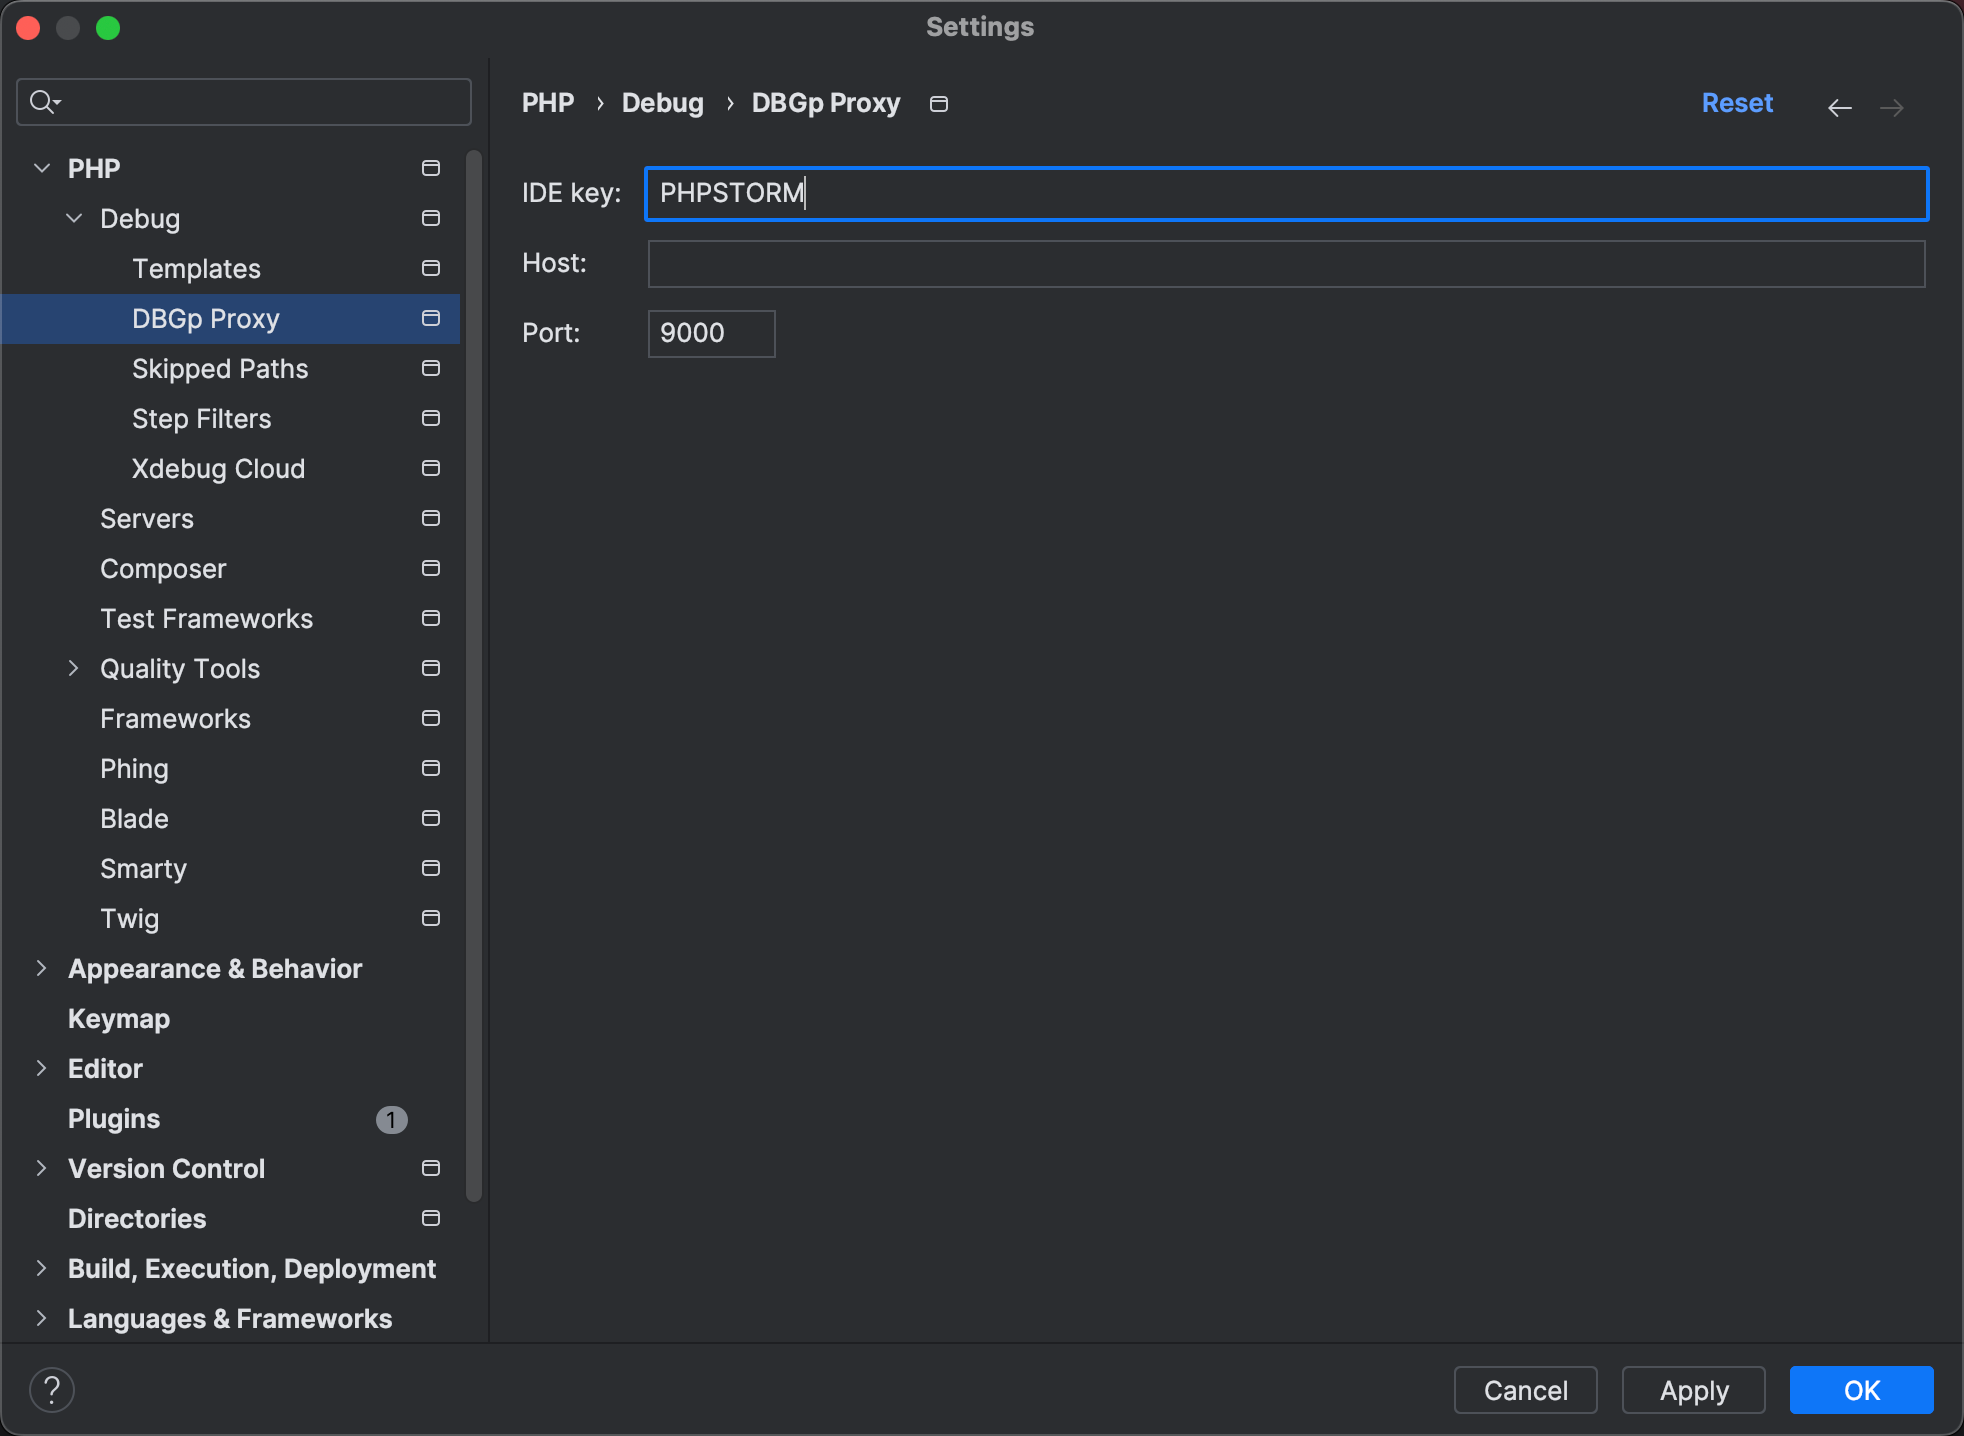
file->settings->PHP->Debug,9000端口是php.ini中Xdebug设置里面xdebug的端口,如果本地已经被占用了可以修改
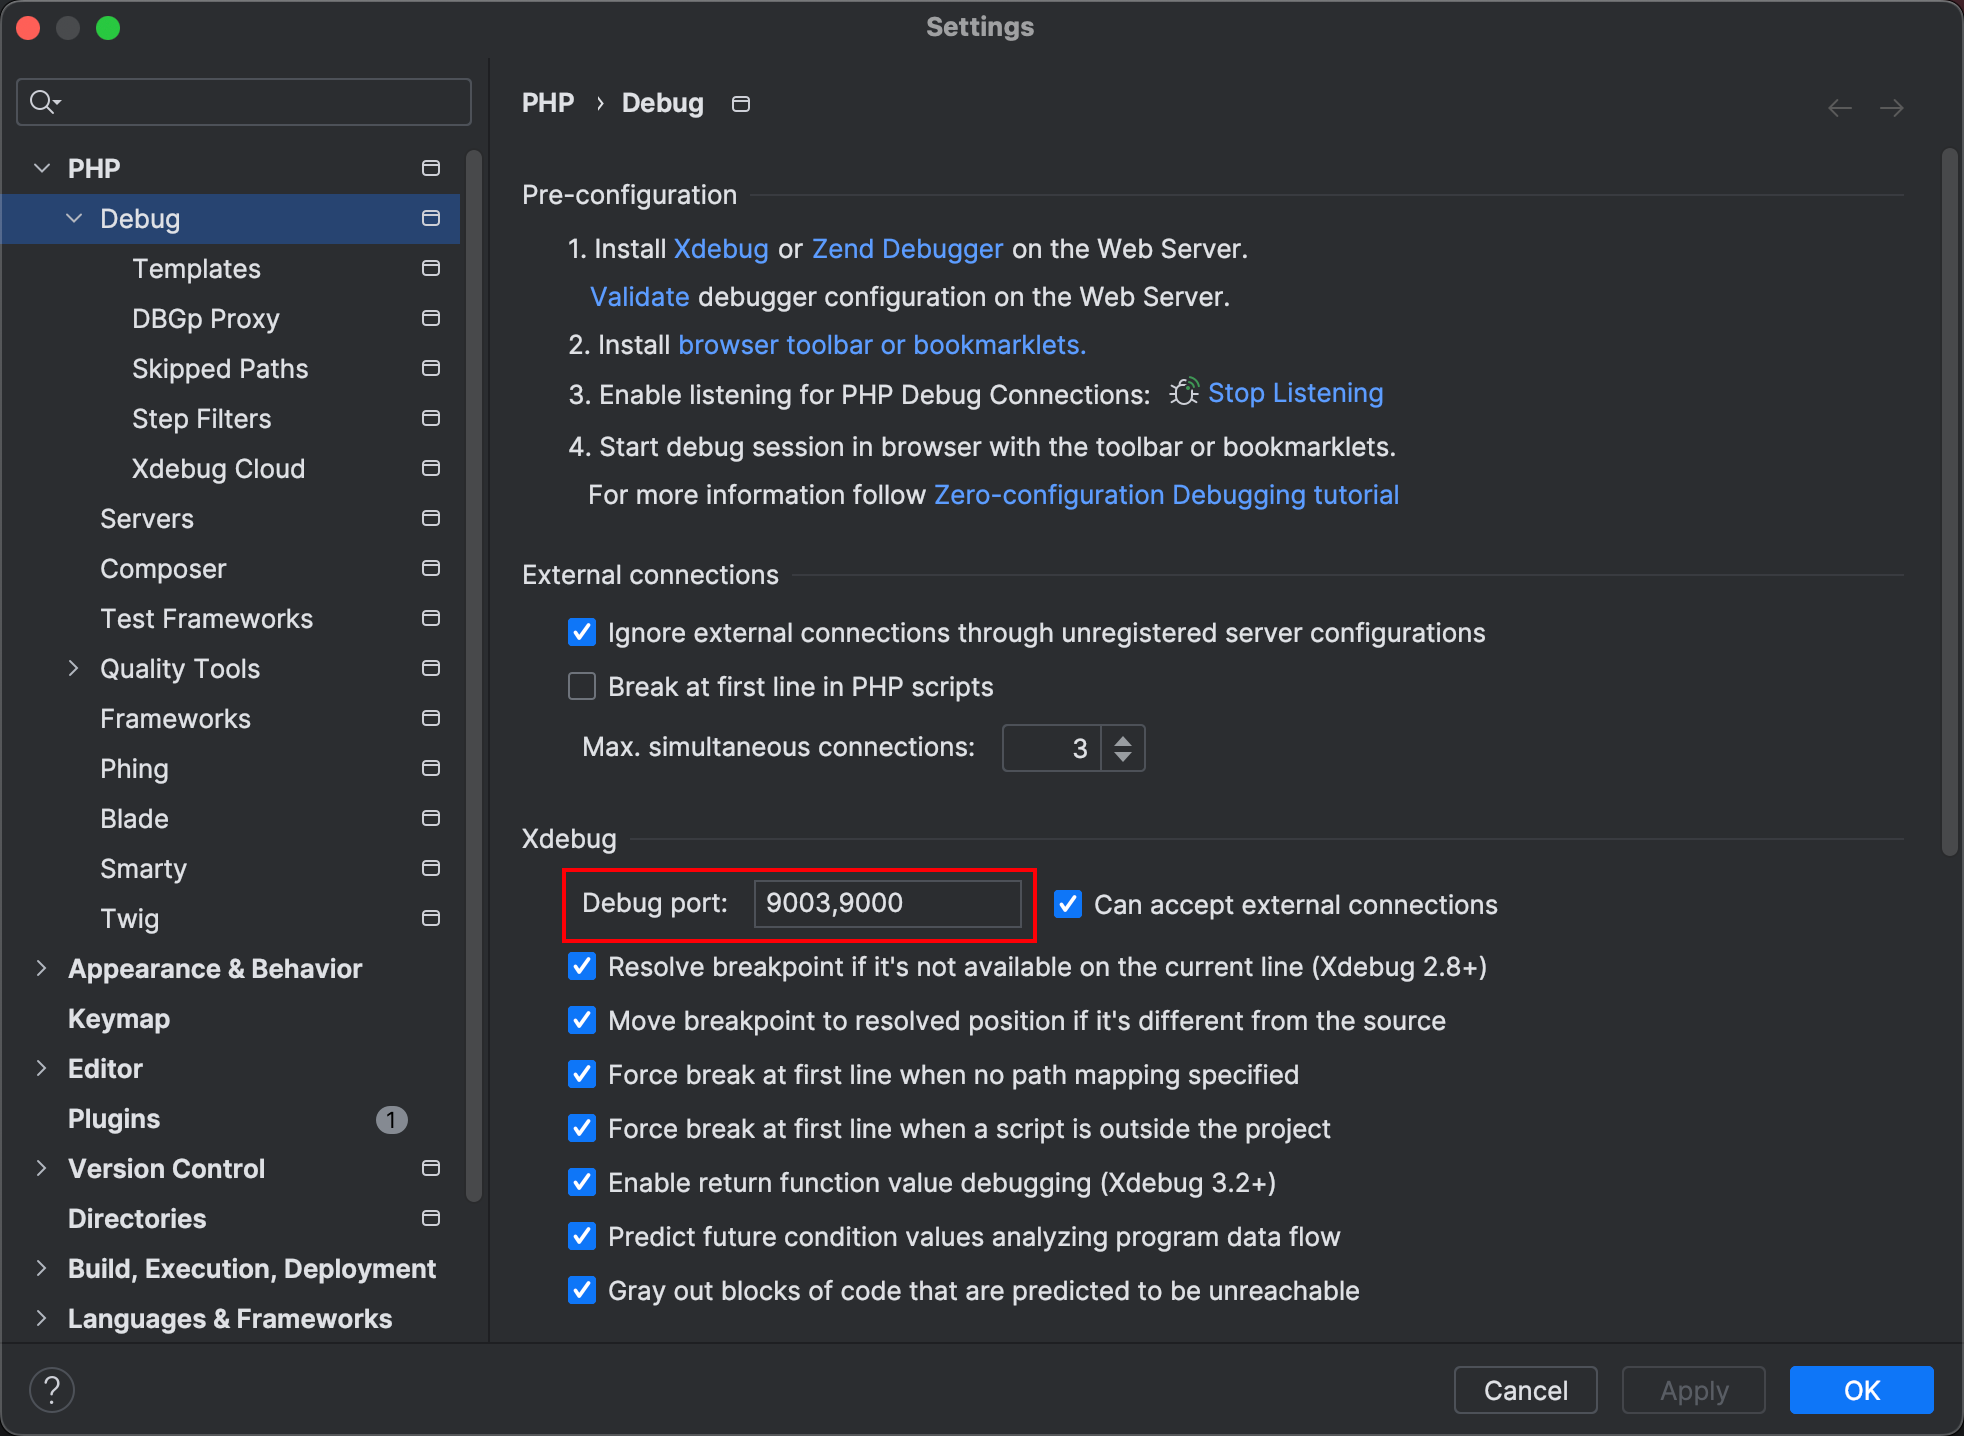
idekey 必须要和xdebug配置的一致
添加php web Page配置
添加php web Page
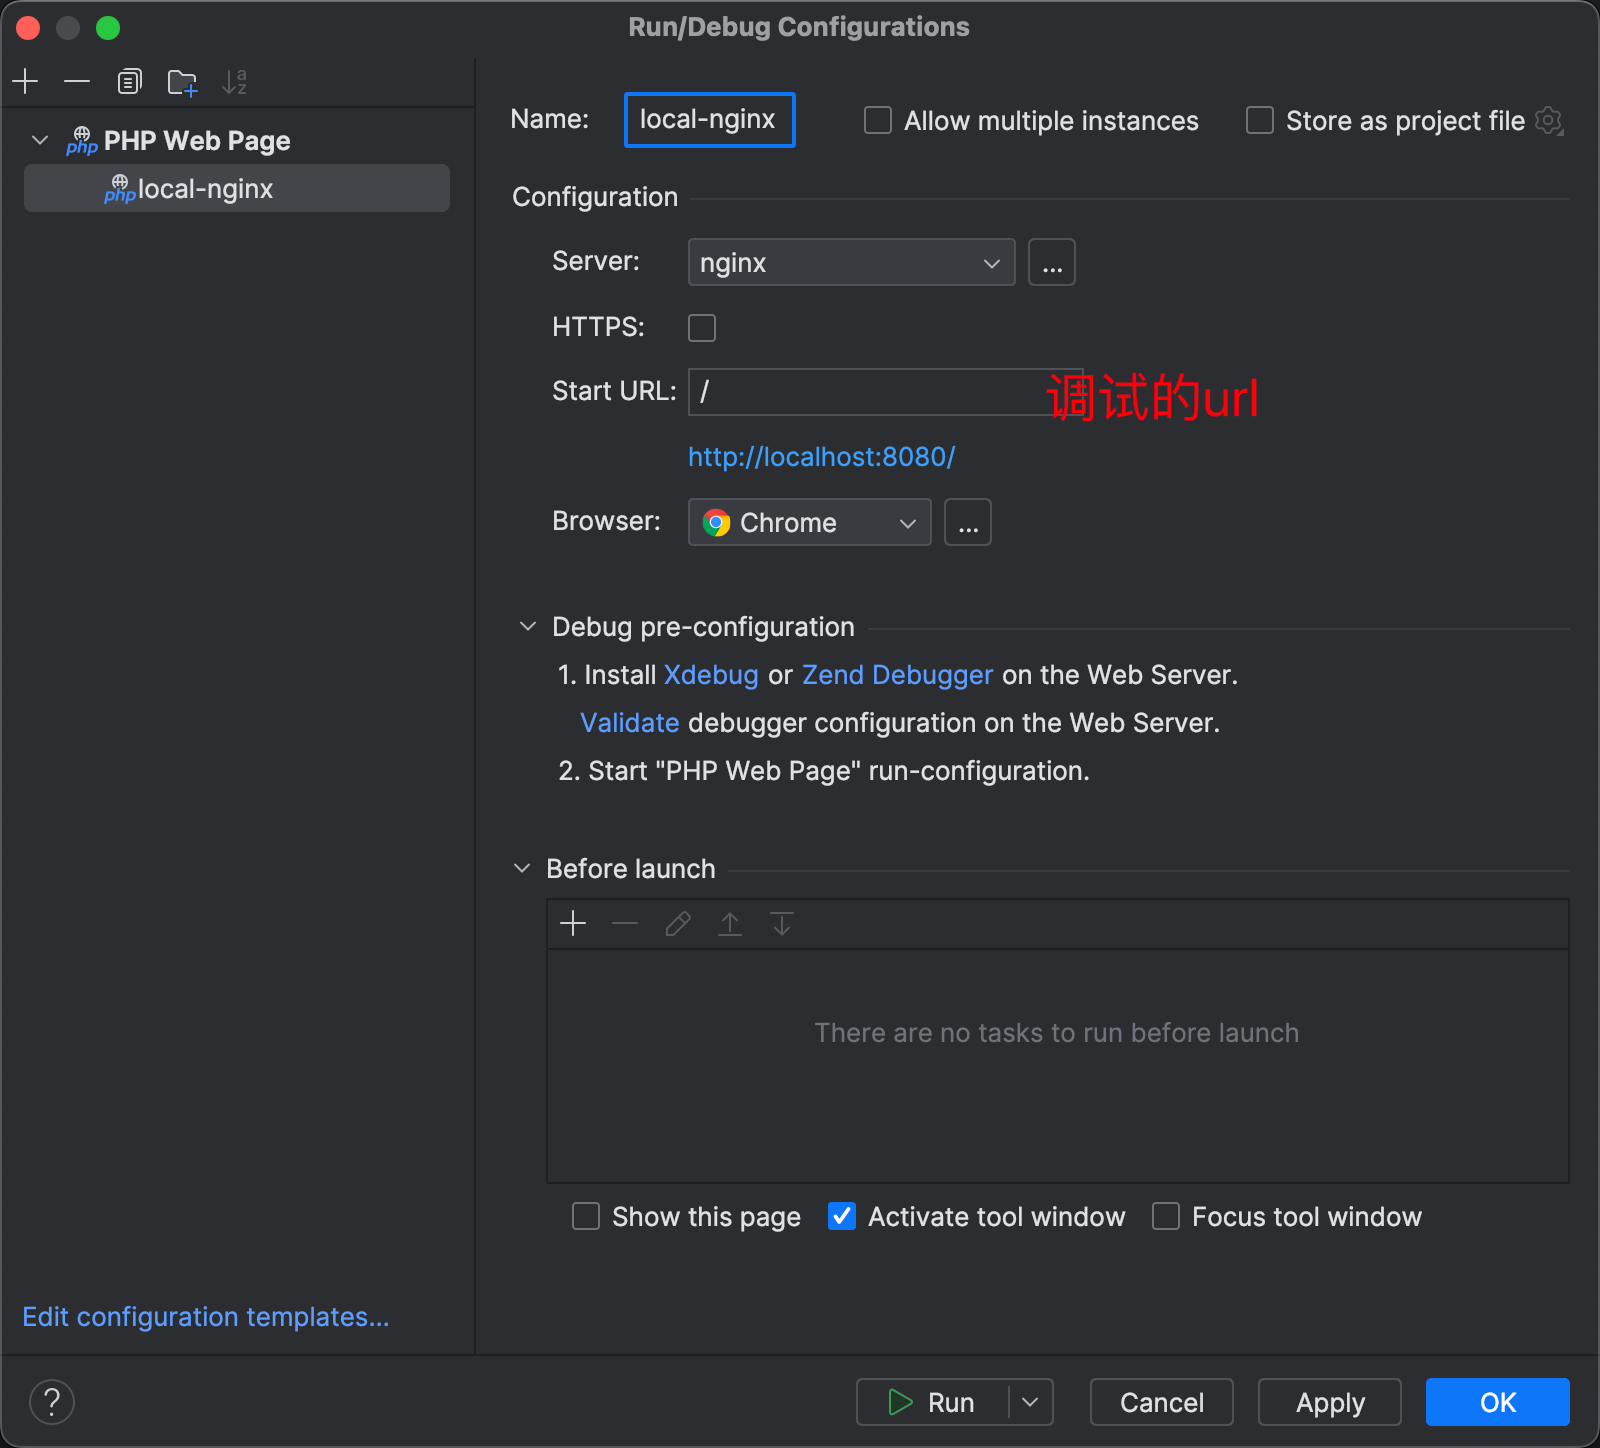
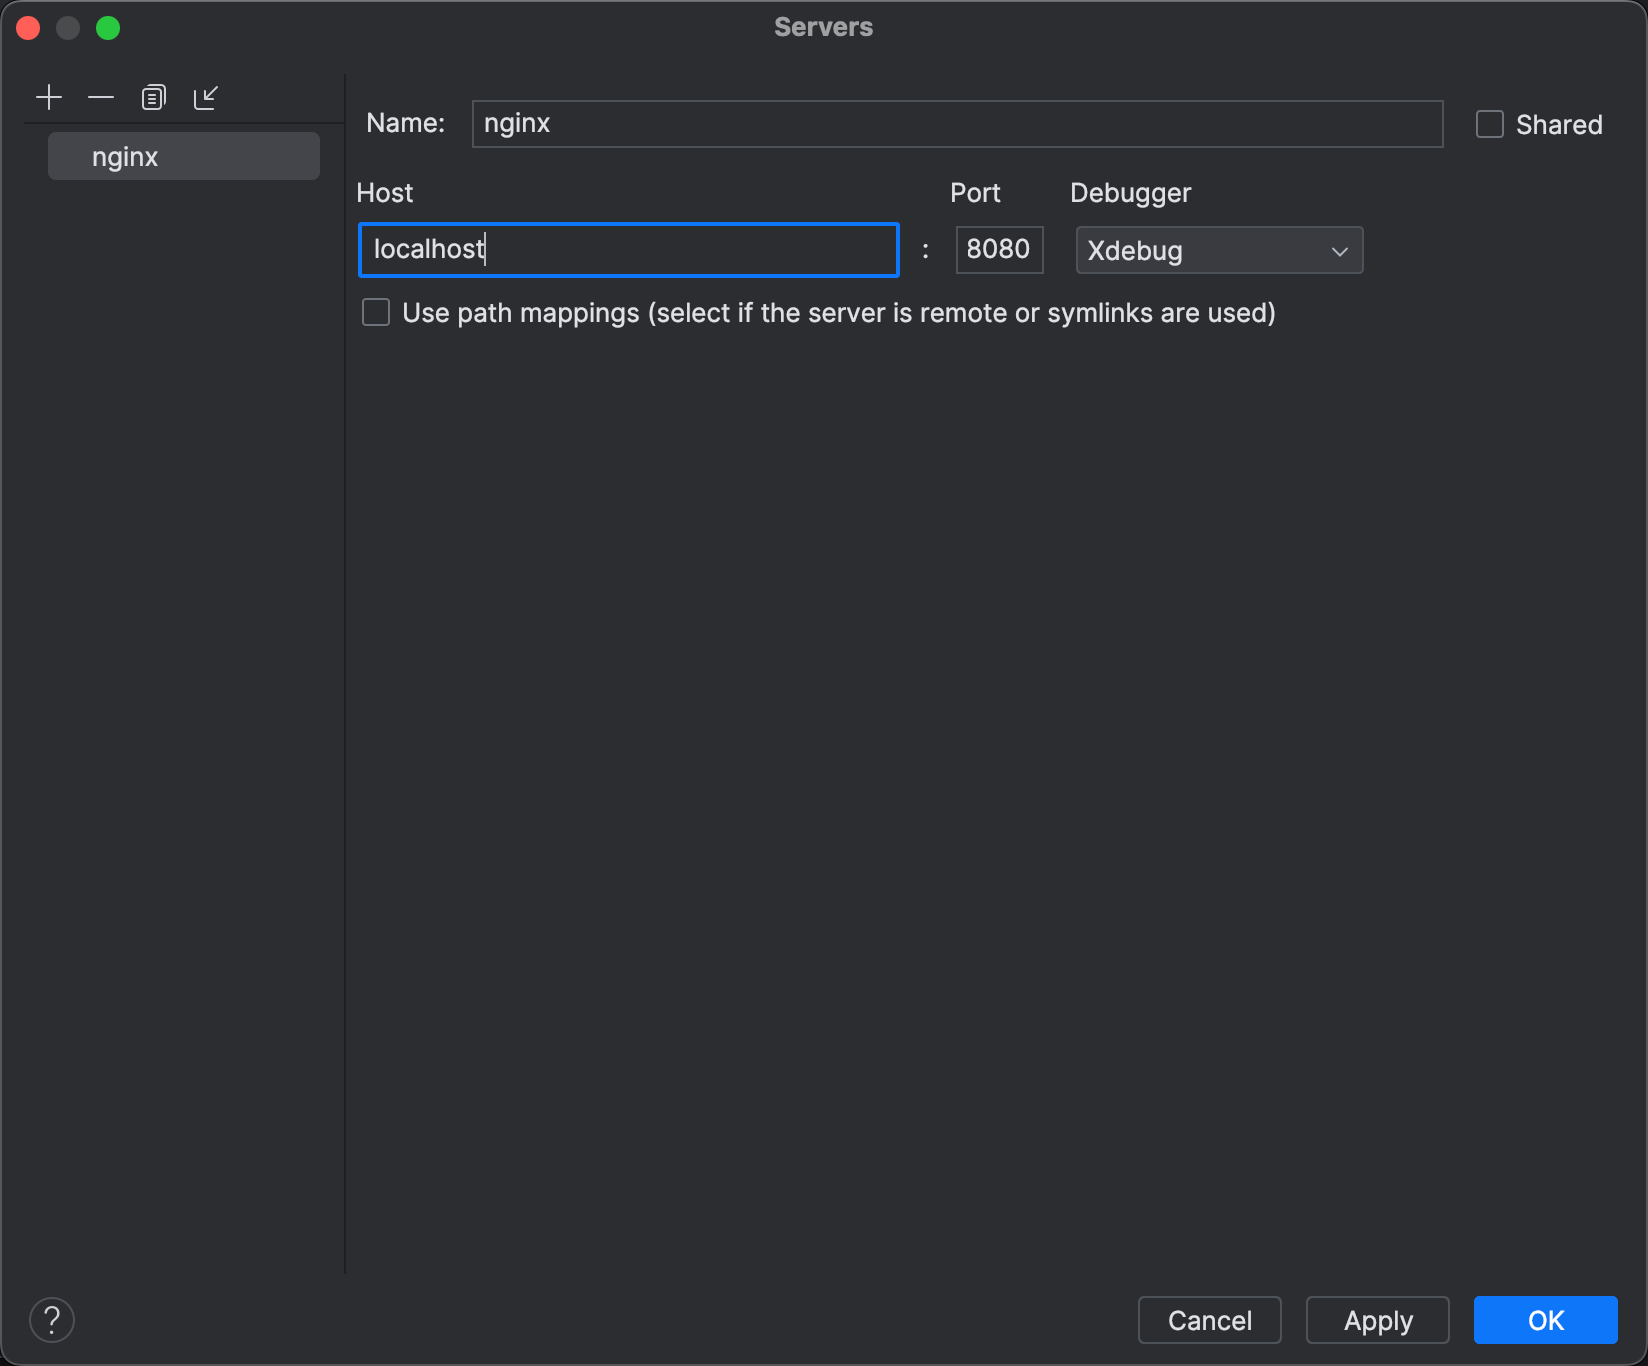
添加server
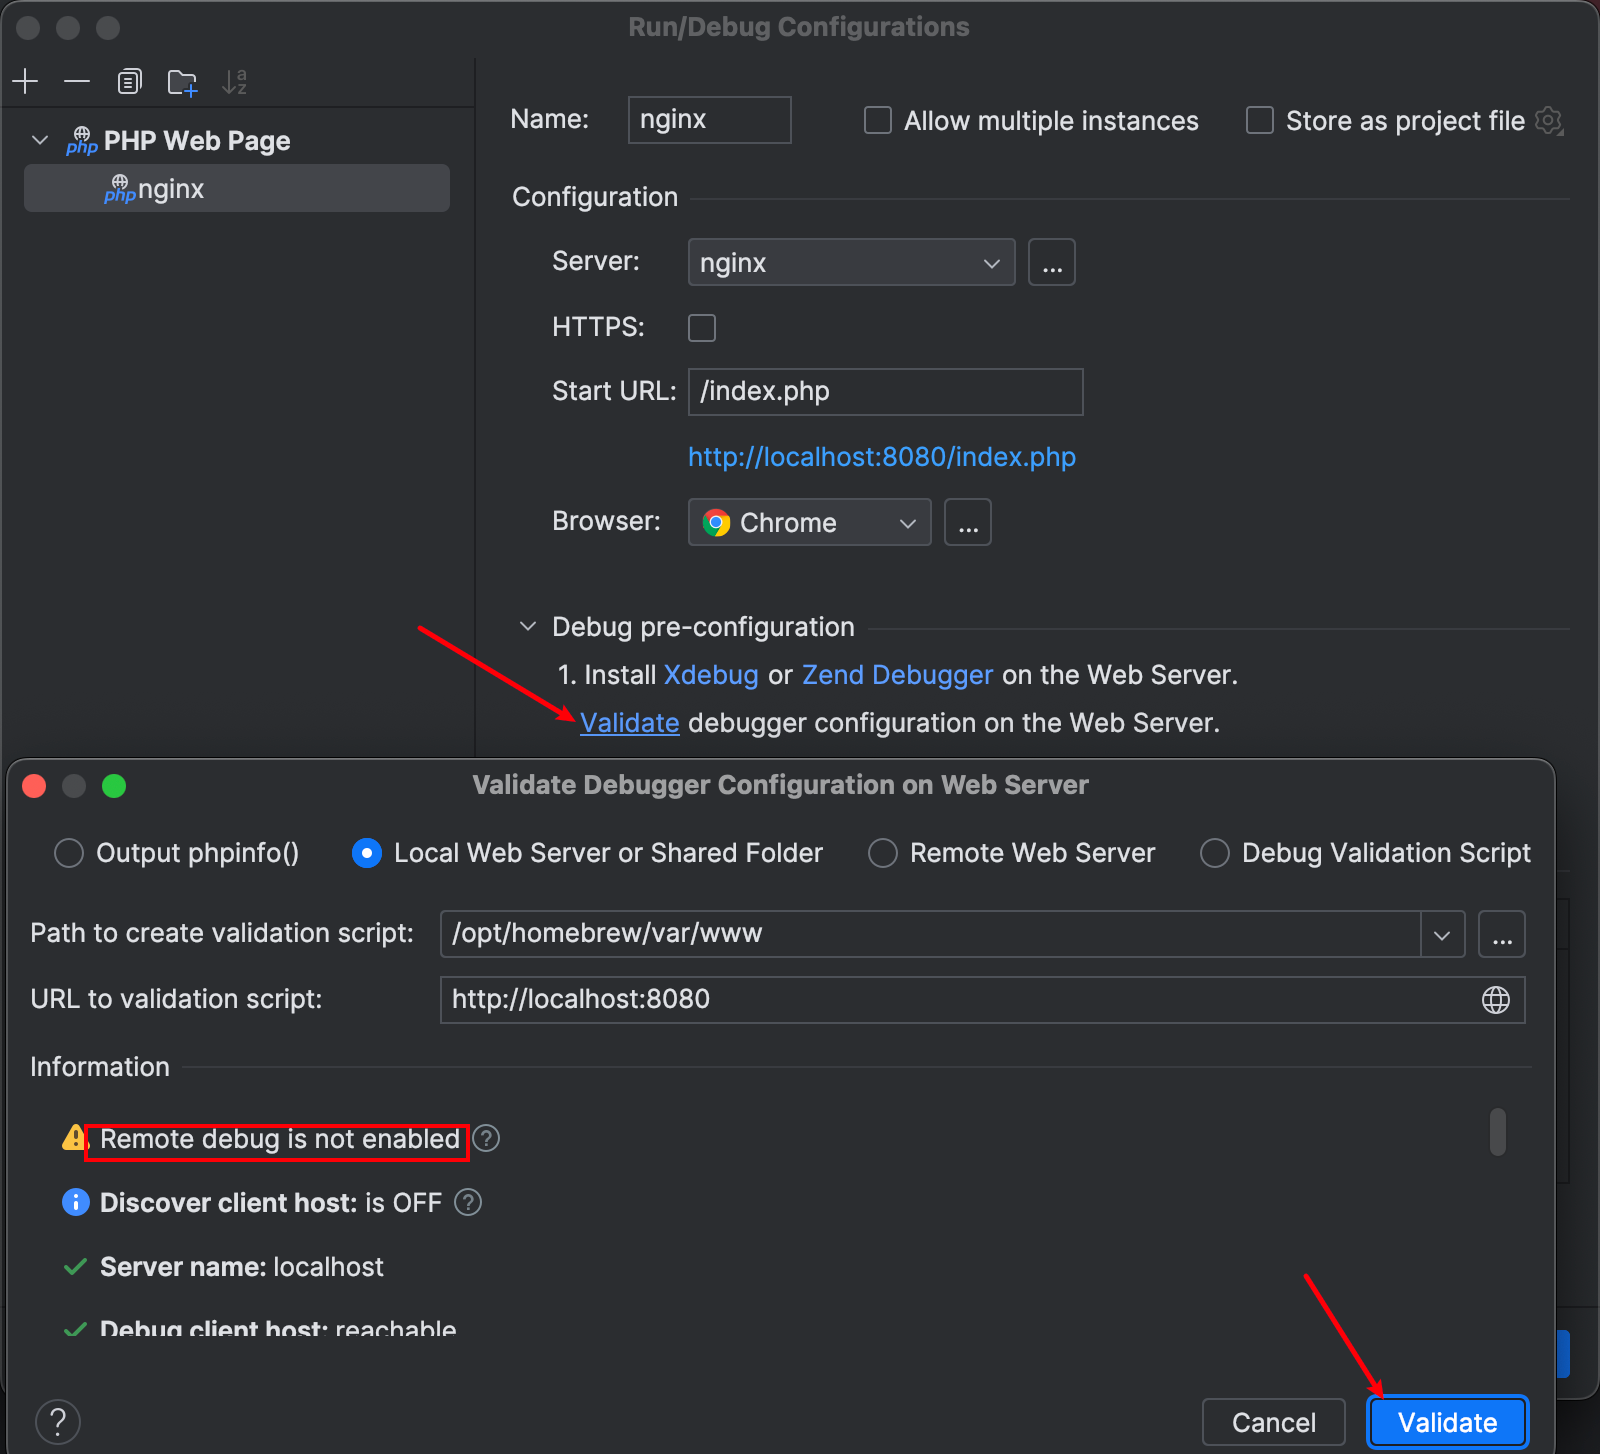
特重要步骤
必须要去验证下是否可用,它会告诉你当前存在的问题或者是否已经可用,按照提示去修复即可。
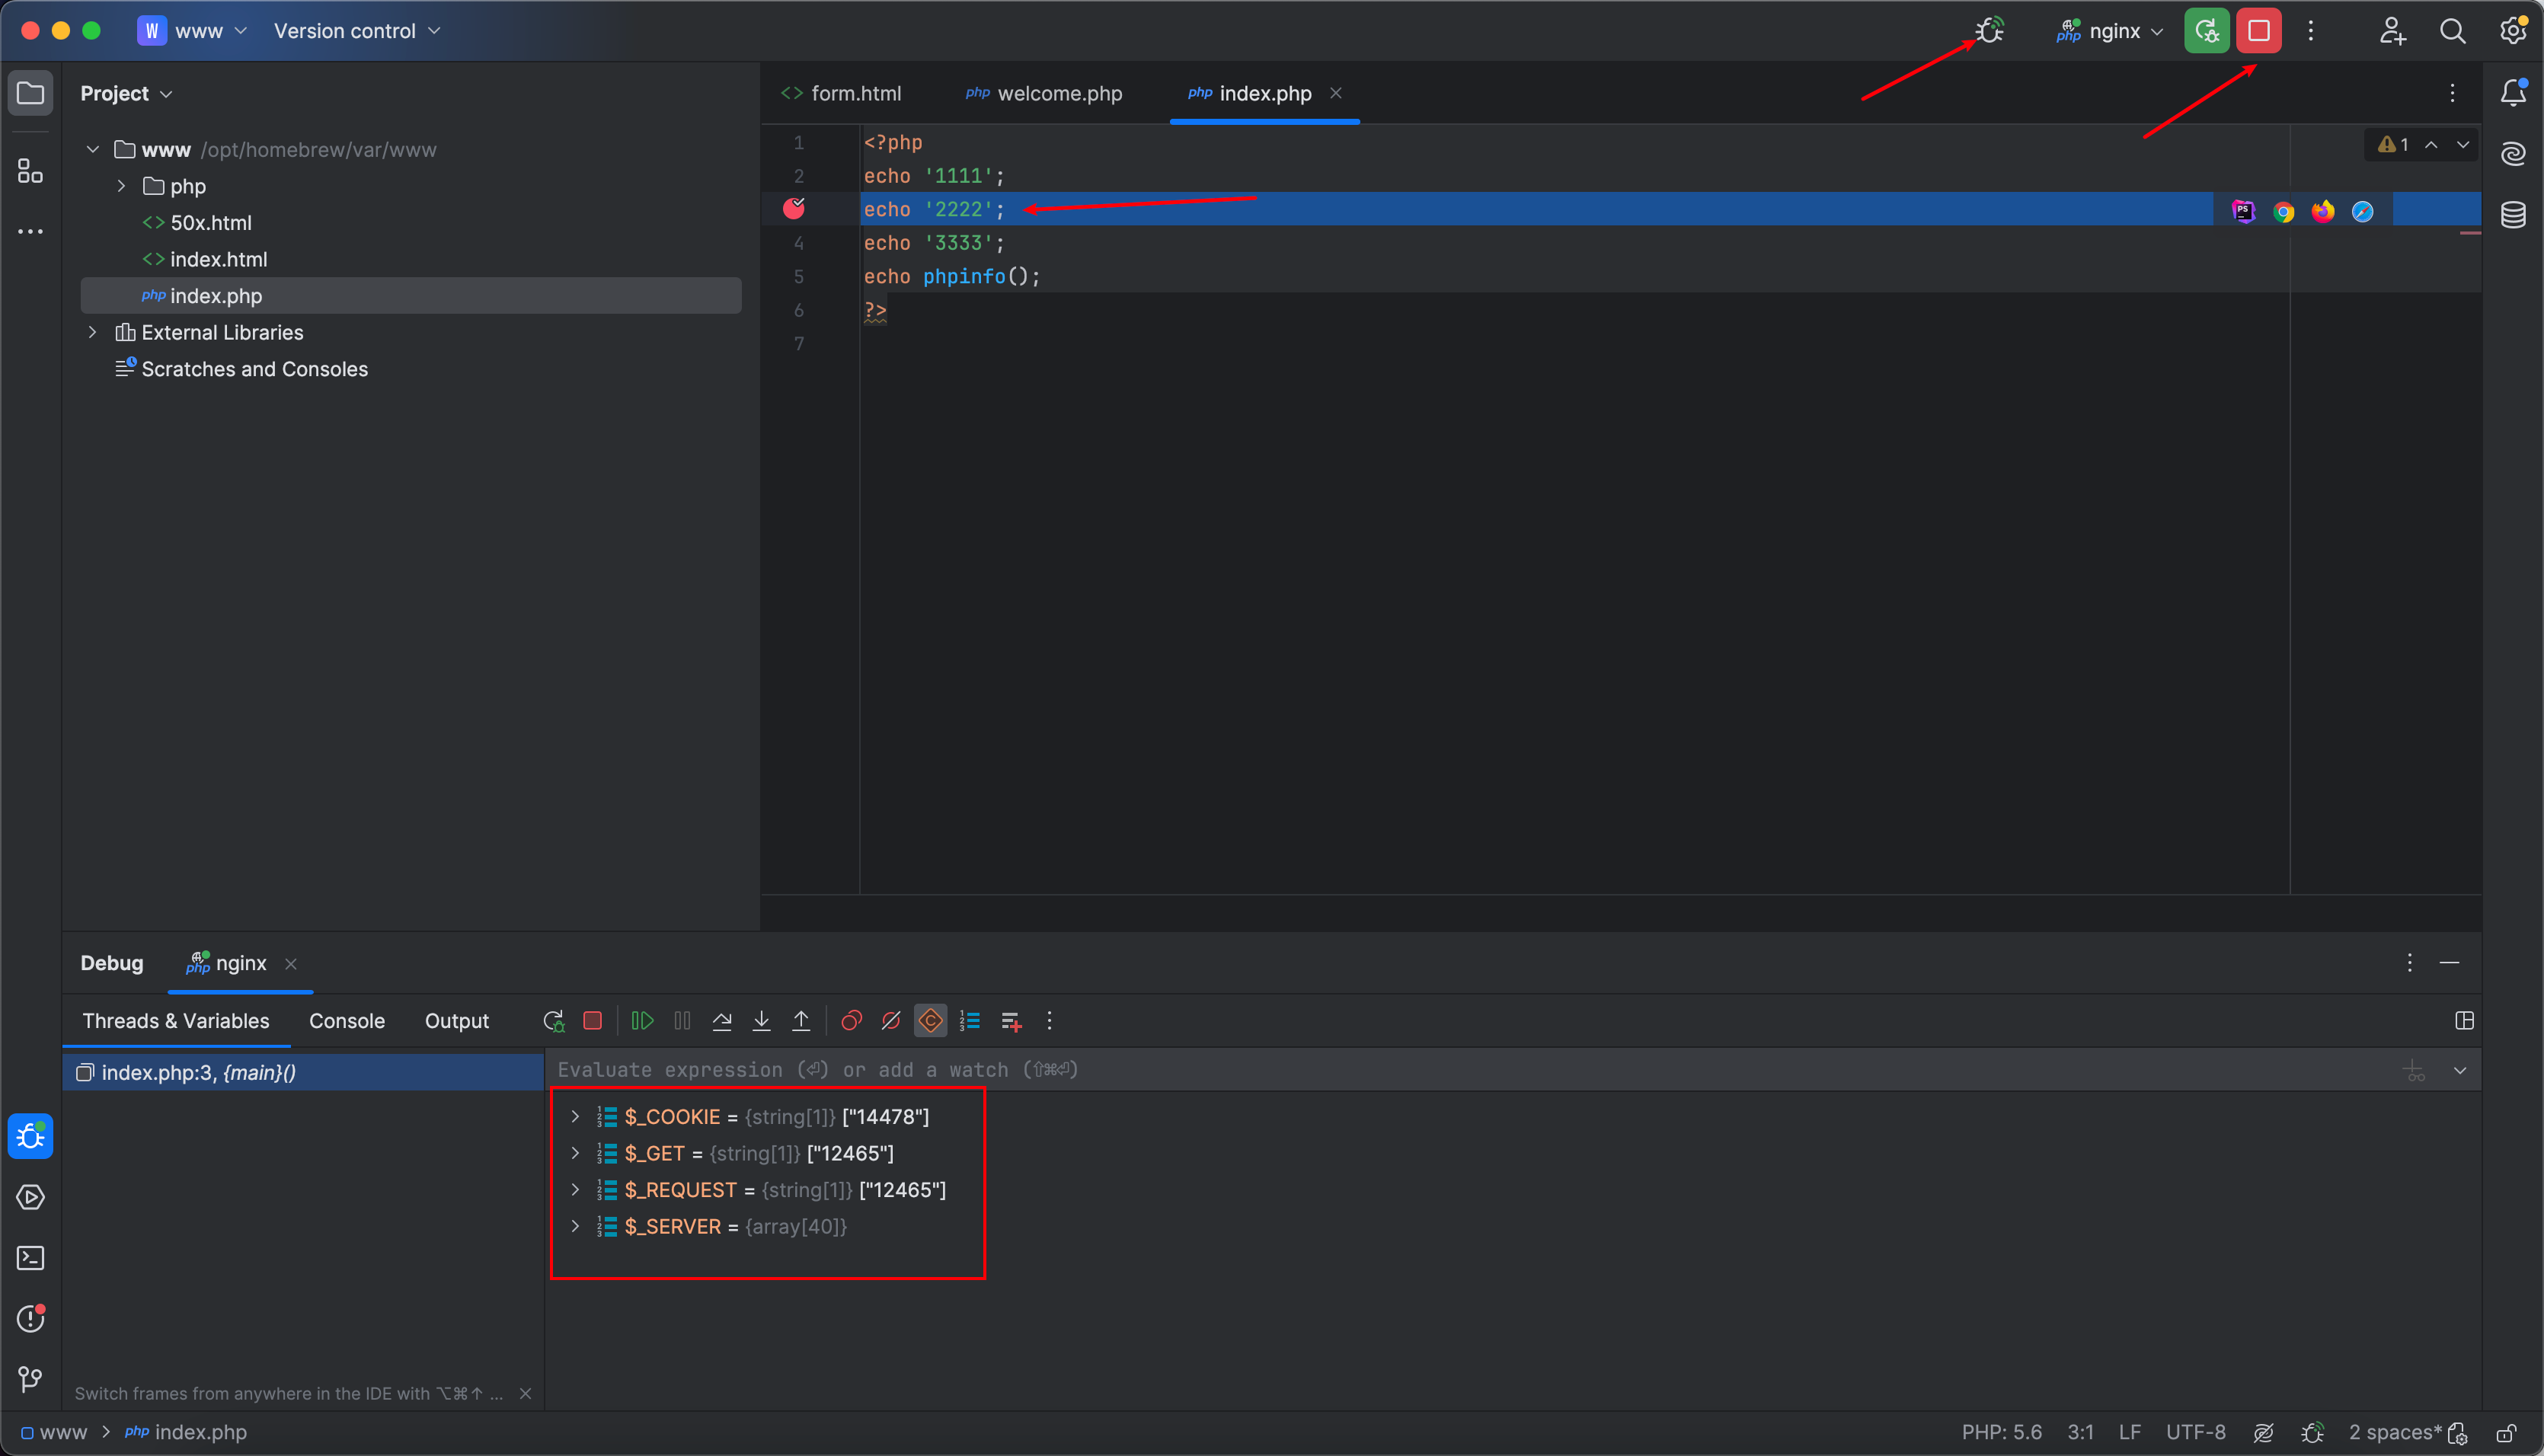
测试
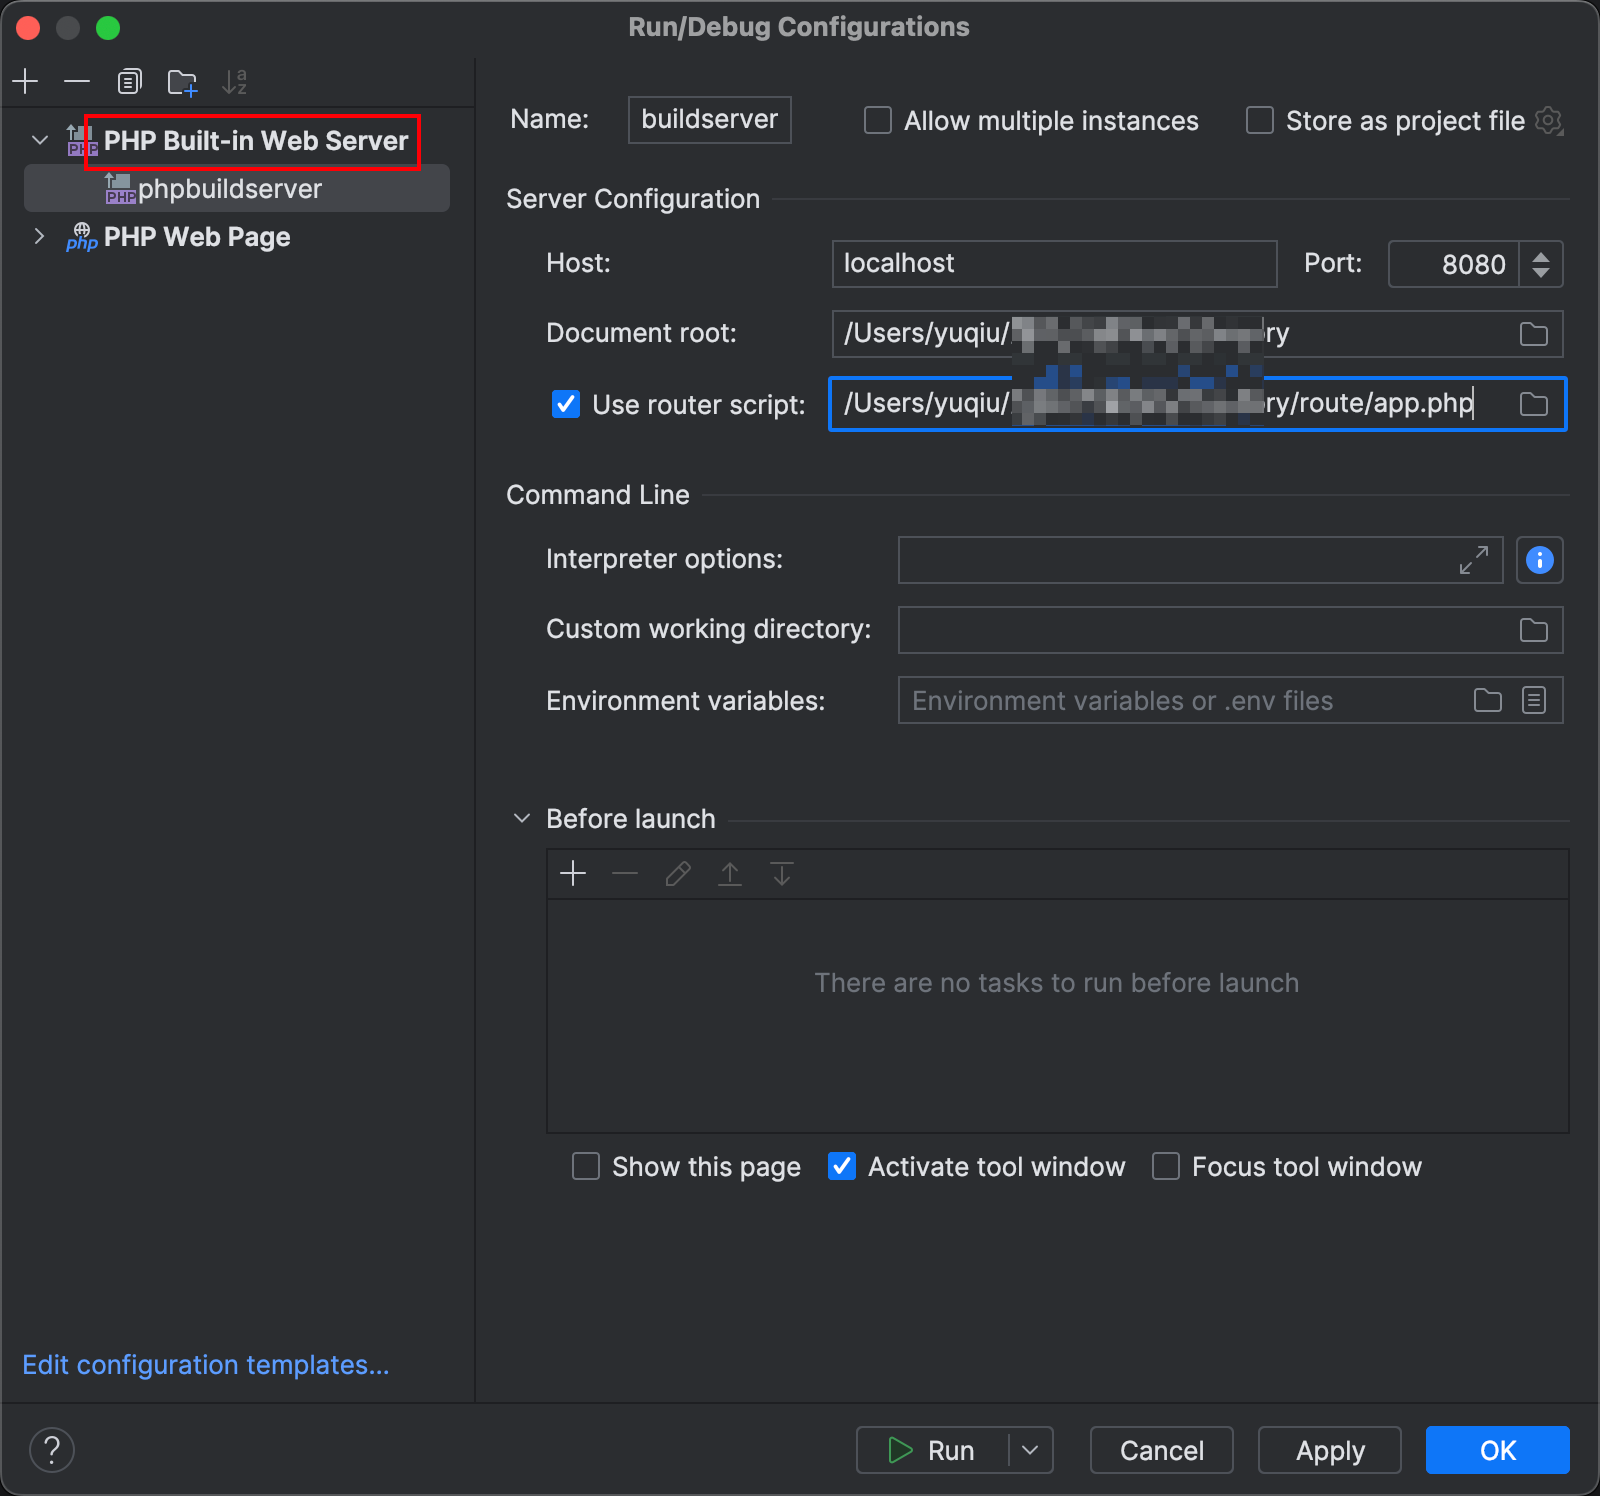
调试thinkphp
添加PHP Built-in Web Server
如果这篇文章对你有用,可以关注本人微信公众号获取更多ヽ(^ω^)ノ ~