PHP 使用xhprof 分析程序
- PHP增加扩展xhrof
git clone https://github.com/longxinH/xhprof.git ./xhprof
cd xhprof/extension/
/path/to/php7/bin/phpize
./configure --with-php-config=/path/to/php7/bin/php-config
make && sudo make install
- PHP配置增加ini
[xhprof]
extension = xhprof.so
xhprof.output_dir = /tmp/xhprof  #选填  将分析结果 放到指定文件夹
xhprof.collect_additional_info = 1  #增加收集更多信息
- 执行代码中加入以下片段 即可进行分析
//开启分析
xhprof_enable(XHPROF_FLAGS_NO_BUILTINS | XHPROF_FLAGS_CPU | XHPROF_FLAGS_MEMORY);

/**
* 执行代码块
*/

$XHPROF_ROOT = realpath(dirname(__FILE__) .'/..');
include_once $XHPROF_ROOT . "/xhprof_lib/utils/xhprof_lib.php";
include_once $XHPROF_ROOT . "/xhprof_lib/utils/xhprof_runs.php";

// 如果ini里没有设置目录 这里可以设置输出目录
$xhprof_output_dir = $XHPROF_ROOT."/xhprof/run/";
$xhprof_runs = new XHProfRuns_Default($xhprof_output_di();

// save the run under a namespace "xhprof_foo"
$run_id = $xhprof_runs->save_run($xhprof_data, "xhprof_foo");
- 创建站点 指向目录 /path/xhprof/xhprof_html/
注:分析结果存放路径问题 如果ini里没有设置目录,需要修改xhprof_html/index.php文件 找到XHProfRuns_Default 设置目录,否则会走默认地址/tmp/ 路径
$xhprof_output_dir =  dirname(__FILE__) ."/../run/";
$xhprof_runs_impl = new XHProfRuns_Default($xhprof_output_dir);
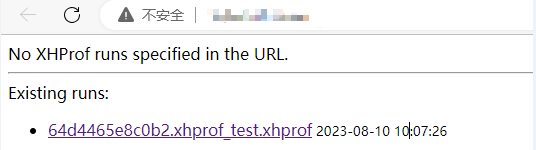
- 执行3步骤 代码块后,访问xhprof站点
分析:
Function Name:方法名称。
Calls:方法被调用的次数。
Calls%:方法调用次数在同级方法总数调用次数中所占的百分比。
Incl.Wall Time(microsec):方法执行花费的时间,包括子方法的执行时间。(单位:微秒)
IWall%:方法执行花费的时间百分比。
Excl. Wall Time(microsec):方法本身执行花费的时间,不包括子方法的执行时间。(单位:微秒)
EWall%:方法本身执行花费的时间百分比。
Incl. CPU(microsecs):方法执行花费的CPU时间,包括子方法的执行时间。(单位:微秒)
ICpu%:方法执行花费的CPU时间百分比。
Excl. CPU(microsec):方法本身执行花费的CPU时间,不包括子方法的执行时间。(单位:微秒)
ECPU%:方法本身执行花费的CPU时间百分比。
Incl.MemUse(bytes):方法执行占用的内存,包括子方法执行占用的内存。(单位:字节)
IMemUse%:方法执行占用的内存百分比。
Excl.MemUse(bytes):方法本身执行占用的内存,不包括子方法执行占用的内存。(单位:字节)
EMemUse%:方法本身执行占用的内存百分比。
Incl.PeakMemUse(bytes):Incl.MemUse峰值。(单位:字节)
IPeakMemUse%:Incl.MemUse峰值百分比。
Excl.PeakMemUse(bytes):Excl.MemUse峰值。单位:(字节)
EeakMemUse%:Excl.MemUse峰值百分比。