2.4(学号:3025)
import numpy as np
import matplotlib.pyplot as plt
定义x的范围
x = np.linspace(-10, 10, 400)
创建一个2行3列的子图布局
fig, axs = plt.subplots(2, 3, figsize=(12, 8))
遍历每个子图
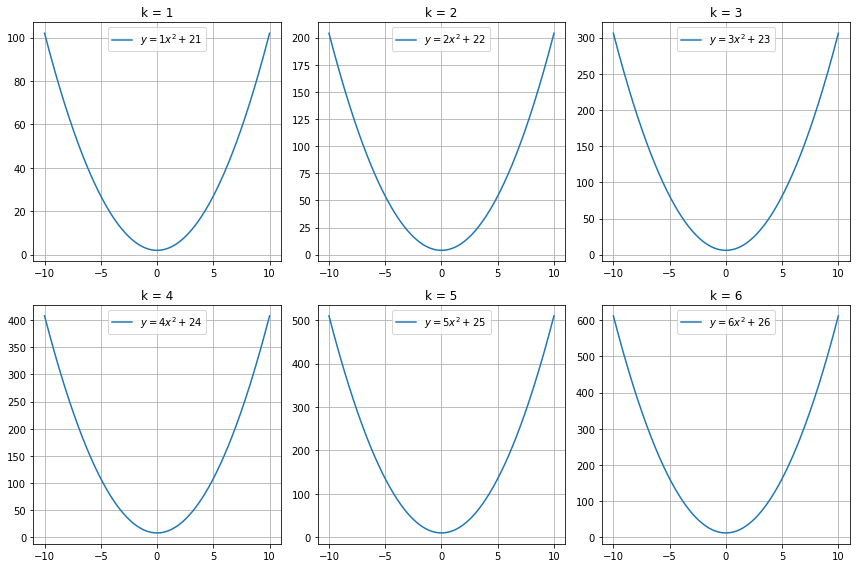
for k, ax in enumerate(axs.flat, start=1):
y = k * x**2 + 2*k
ax.plot(x, y, label=f'$y = {k}x^2 + 2{k}$')
ax.set_title(f'k = {k}')
ax.legend()
ax.grid(True)
调整子图之间的间距
plt.tight_layout()
显示图形
plt.show()
print("学号:3025")