习题2.4
1.代码实现
点击查看代码
import numpy as np
import matplotlib.pyplot as plt
# 定义x的范围
x = np.linspace(-10, 10, 400)
# 创建一个2行3列的子图网格
fig, axs = plt.subplots(2, 3, figsize=(12, 8))
# 遍历k值,并在对应的子图中绘制函数图像
k_values = [1, 2, 3, 4, 5, 6]
x_limits=[(-5,5),(-10,10),(-15,15),(-20,20),(-25,25),(-30,30)]
for i, k in enumerate(k_values):
row = i // 3 # 计算行索引
col = i % 3 # 计算列索引
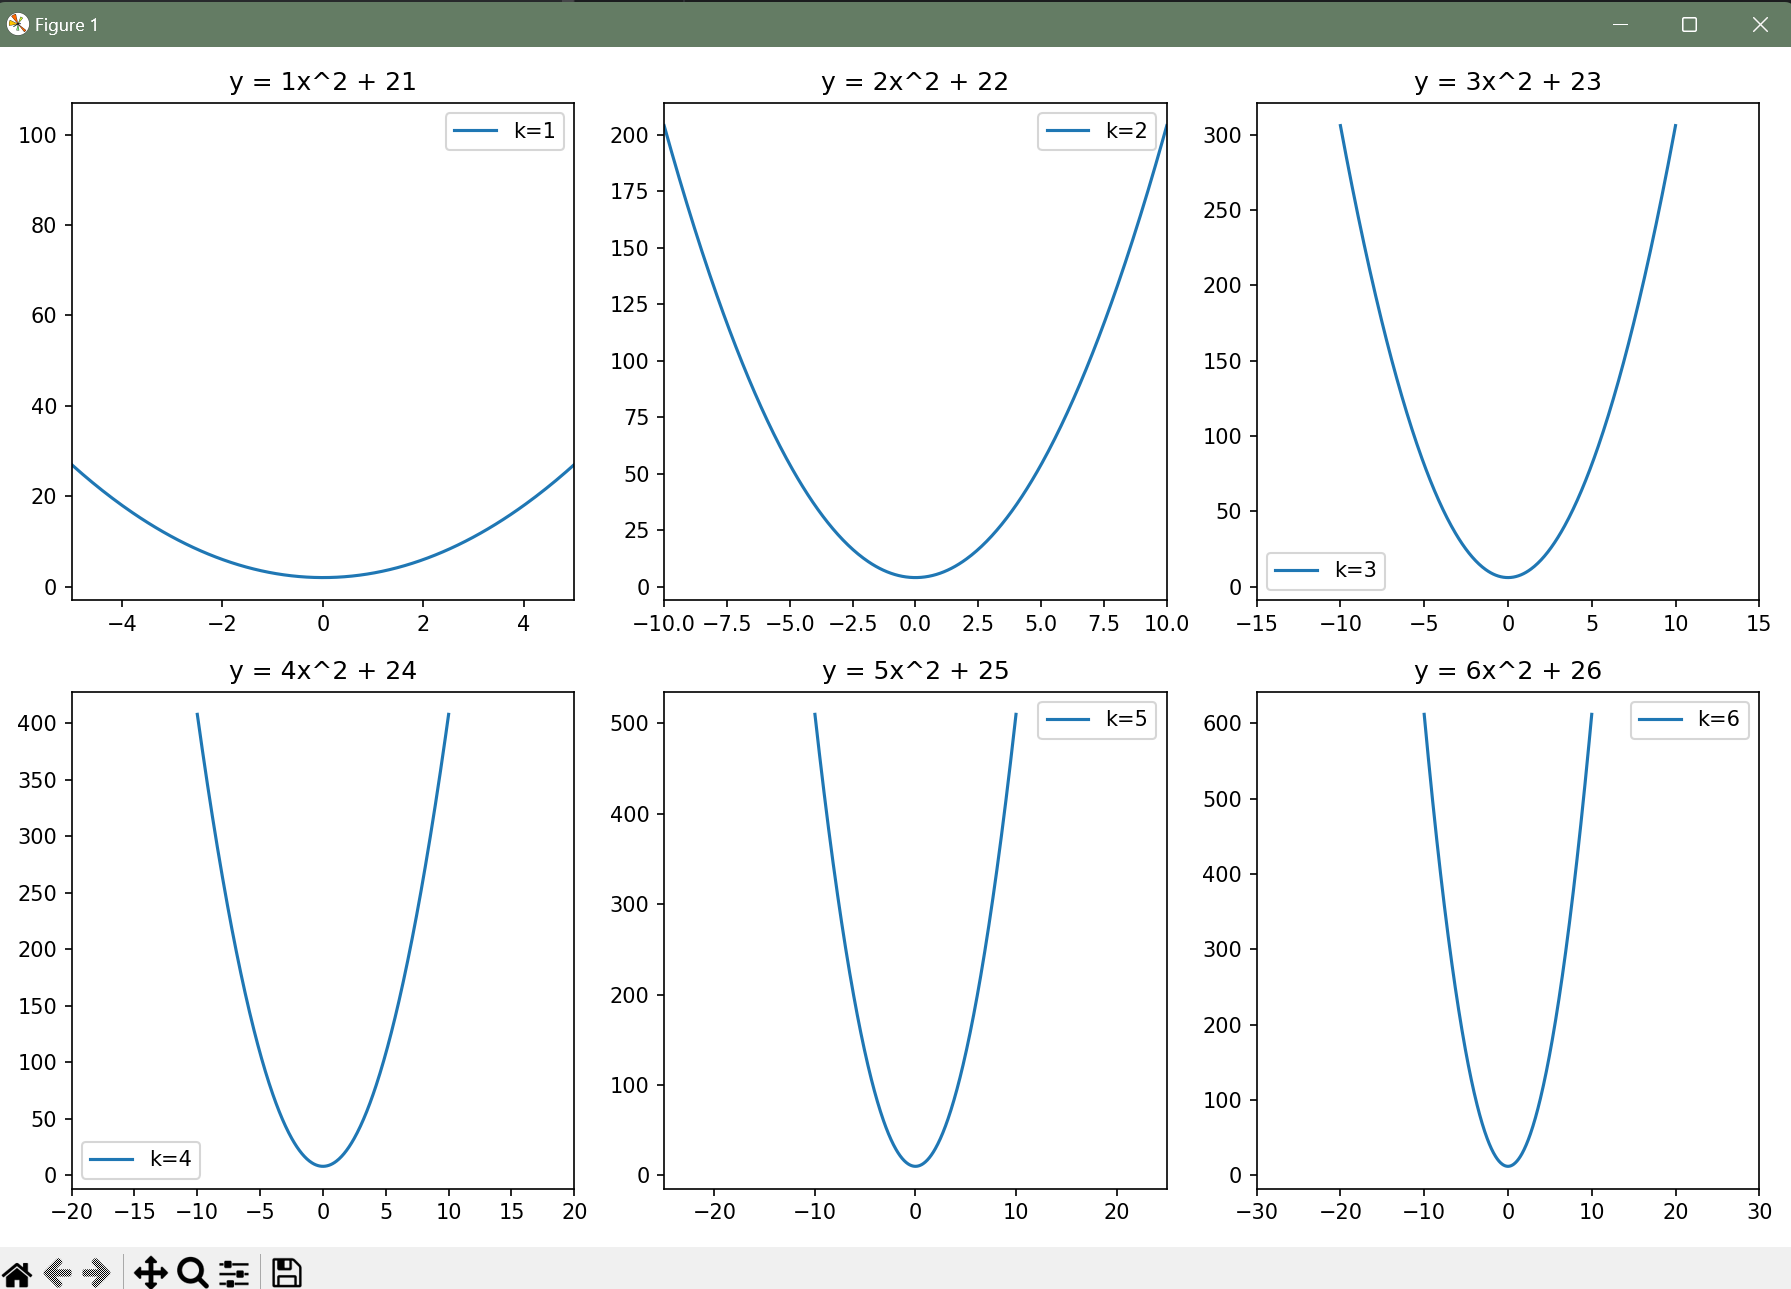
y = k * x ** 2 + 2 * k # 计算y值
axs[row, col].plot(x, y, label=f'k={k}')
axs[row, col].set_title(f'y = {k}x^2 + 2{k}')
axs[row, col].legend()
axs[row,col].set_xlim(x_limits[i])
# 调整子图之间的间距和布局
plt.tight_layout()
# 显示图形
plt.show()
2.运行结果