20230817 chapter3 tooling up 学习make GDB git 等工具

make -B 强制重新make
gdb之前,需要先在编译时加入 -g 参数以开启debug模式,修改一下makefile;
TARGET=move

ifdef DEBUG
DEBUGFLGS = -g
else
DEBUGFLGS =
endif

$(TARGET): $(TARGET).o
        ld -o $@  $^

%.o:%.s
        as $(DEBUGFLGS)  -o $@ $<

clean:
        rm *.o $(TARGET)
现在,开启debug模式有2种方式
1,直接 make DEBUG=1

2,在环境变量里面添加 ,
export DEBUG=1
使用GDB: gdb 程序名称
gdb move

run 或者 r 直接运行
list或者 l 显示10行,再次键入l 再显示10hang

list 1,1000
to list our entire program.
disassemble _start 反汇编程序

use the breakpoint command (or b):
b _start 设置断点
b 行号

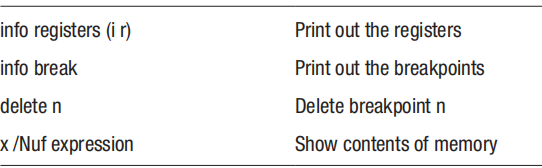
info
registers (or i r): 查看寄存器值

step command (or s). 单步调试;
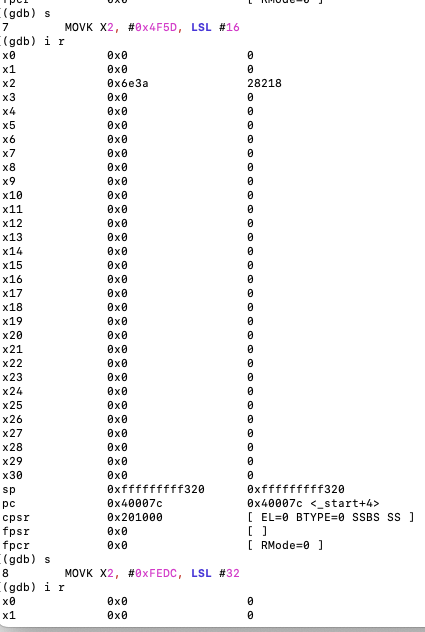
continue (or c), to continue to
the next breakpoint or to the end of the program. c 继续运行至下一个断点,
info breakpoints
(or i b) command; 查看设置的断点, delete 删除某个断点

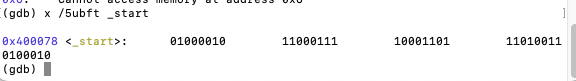
display memory in different formats, the main command being x. It has
the following format:
x /Nfu addr 显示内存信息
where
• N is the number of objects to display
• f is the display format where some common ones are
• t for binary
• x for hexadecimal
• d for decimal
• i for instruction
• s for string
• u is unit size and is any of
• b for bytes
• h for halfwords (16 bits)
• w for words (32 bits)
• g for giant words (64 bits)
To exit gdb, type q (for quit or type control-d). 退出GDB

 交叉编译
交叉编译
sudo apt-get install gcc-aarch64-linux-gnu g++-aarch64-linux-gnu
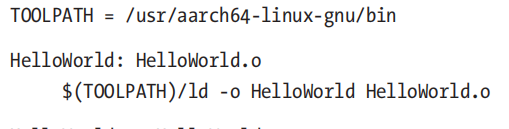 修改一下 makefile,直接指定编译程序
 仿真
仿真
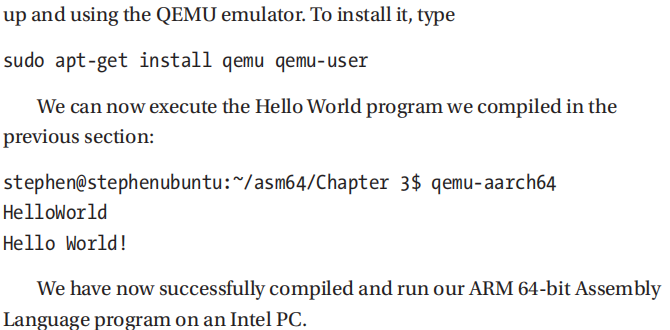
如果没有arm64CPU 也可以在intel CPU 的linux下安装qemu来仿真arm CPU
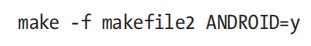 -f 手动指定 makefile;