[转帖]oracle OSWatcher安装部署
Oswatch是oracle官方提供,用于收集操作系统性能的小工具,oswatch的安装与使用也比较简单,直接解压就可以使用。oswatch是通过调用系统的命令完成信息的收集,如:ps ,top ,mpstat ,iostat,netstat ,traceroute vmstat 。支持的操作系统包括AIX,Solaris ,Linux等 。
1、解压oswbb软件到指定的目录
- ######这里我使用的是v8.4的版本,直接放到root目录下
- [root@oracle19c ~]# tar xvf oswbb840.tar
- oswbb/
- oswbb/uncpr.bat
- oswbb/sarsub.sh
- oswbb/psmemsub.sh
- oswbb/stopOSWbb.sh
- oswbb/analysis/
- oswbb/piddsub.sh
- oswbb/arpsub.sh
- oswbb/docs/
- oswbb/docs/OSWatcher/
- oswbb/docs/OSWatcher/oswbb_README.txt
2、安装jdk8.0以上版本,oswbba需要调用
- #####解压jdk8.0版本到指定目录
- [root@oracle19c archive]# tar xzvf jdk1.8.0_11.tar.gz
- #####设置java home环境变量
- vi .bash_profile
- JAVA_HOME=/root/jdk1.8.0_11
- PATH=$JAVA_HOME/bin:$HOME/bin
3、启动Oswatcher收集系统资源状态
- ######设置lang环境变量
- [root@oracle19c oswbb]# export LANG=zh_US
- [root@oracle19c oswbb]# date
- Fri Aug 27 15:44:39 CST 2021
- [root@oracle19c oswbb]#
- #####示例:启动oswbb.sh 以5秒钟一次并删除1个小时前的归档数据,收集的数据存放在archive目录,默认1个小时进行归档
- [root@oracle19c oswbb]# ./startOSWbb.sh 5 1 gzip /root/oswbb/archive/
- [root@oracle19c oswbb]# Info...Zip option IS specified.
- Info...OSW will use /root/oswbb/archive/ to compress files.
- Setting the archive log directory to/root/oswbb/archive
- Testing for discovery of OS Utilities...
- VMSTAT found on your system.
- IOSTAT found on your system.
- MPSTAT found on your system.
- IP found on your system.
- TOP found on your system.
- PIDSTAT found on your system.
- NFSIOSTAT found on your system.
- TRACEROUTE found on your system.
- Discovery of CPU CORE COUNT
- CPU CORE COUNT will be used by oswbba to automatically look for cpu problems
- CPU CORE COUNT = 4
- VCPUS/THREADS = 4
- Discovery completed.
- Starting OSWatcher v8.4.0 on Fri Aug 27 15:10:59 CST 2021
- With SnapshotInterval = 5
- With ArchiveInterval = 1
- OSWatcher - Written by Carl Davis, Center of Expertise,
- Oracle Corporation
- For questions on install/usage please go to MOS (Note:301137.1)
- Data is stored in directory: /root/oswbb/archive
- Starting Data Collection...
- oswbb heartbeat:Fri Aug 27 15:24:50 CST 2021
- oswbb heartbeat:Fri Aug 27 15:24:55 CST 2021
- oswbb heartbeat:Fri Aug 27 15:25:00 CST 2021
- ............
4、到archive目录,看到到已经收集到的系统状态
- #####进入到archive,查看已经收集到的数据
- [root@oracle19c oswbb]# cd archive/
- [root@oracle19c archive]# ls
- oswarp oswcpuinfo oswifconfig oswiostat oswmeminfo oswmpstat oswnetstat oswnfsiostat oswpidstat oswpidstatd oswprvtnet oswps oswslabinfo oswtop oswvmstat oswxentop
- [root@oracle19c archive]#
- #######查看已经收集到的磁盘io信息
- [root@oracle19c archive]# cd oswiostat/
- [root@oracle19c oswiostat]#
- [root@oracle19c oswiostat]#
- [root@oracle19c oswiostat]# cat oracle19c_iostat_21.08.27.1500.dat |more
- Linux OSWbb v8.4.0
- zzz ***Fri Aug 27 15:24:50 CST 2021
- avg-cpu: %user %nice %system %iowait %steal %idle
- 0.25 0.00 1.01 0.00 0.00 98.74
-
- Device: rrqm/s wrqm/s r/s w/s rkB/s wkB/s avgrq-sz avgqu-sz await r_await w_await svctm %util
- sda 0.00 2.00 0.00 11.00 0.00 98.50 17.91 0.01 0.82 0.00 0.82 0.09 0.10
- sdb 0.00 0.00 0.00 0.00 0.00 0.00 0.00 0.00 0.00 0.00 0.00 0.00 0.00
-
- zzz ***Fri Aug 27 15:24:55 CST 2021
- avg-cpu: %user %nice %system %iowait %steal %idle
- 0.50 0.00 1.51 0.00 0.00 97.98
-
- Device: rrqm/s wrqm/s r/s w/s rkB/s wkB/s avgrq-sz avgqu-sz await r_await w_await svctm %util
- sda 0.00 0.00 0.00 0.00 0.00 0.00 0.00 0.00 0.00 0.00 0.00 0.00 0.00
- sdb 0.00 0.00 0.00 2.00 0.00 32.00 32.00 0.00 0.00 0.00 0.00 0.00 0.00
-
- zzz ***Fri Aug 27 15:25:00 CST 2021
- avg-cpu: %user %nice %system %iowait %steal %idle
- 0.25 0.00 1.26 0.00 0.00 98.49
-
- Device: rrqm/s wrqm/s r/s w/s rkB/s wkB/s avgrq-sz avgqu-sz await r_await w_await svctm %util
- sda 0.00 0.00 0.00 0.00 0.00 0.00 0.00 0.00 0.00 0.00 0.00 0.00 0.00
- sdb 0.00 0.00 0.00 0.00 0.00 0.00 0.00 0.00 0.00 0.00 0.00 0.00 0.00
-
-
- #####查看已收集到的top信息
- [root@oracle19c archive]# cd oswtop/
- [root@oracle19c oswtop]# ls
- oracle19c_top_21.08.27.1500.dat
- [root@oracle19c oswtop]# cat oracle19c_top_21.08.27.1500.dat |more
- Linux OSWbb v8.4.0
- zzz ***Fri Aug 27 15:25:21 CST 2021
- top - 15:25:22 up 57 min, 3 users, load average: 0.90, 1.54, 1.37
- Tasks: 289 total, 14 running, 275 sleeping, 0 stopped, 0 zombie
- %Cpu(s): 2.2 us, 5.2 sy, 0.0 ni, 27.4 id, 59.3 wa, 0.0 hi, 5.9 si, 0.0 st
- KiB Mem : 5780284 total, 2805832 free, 773836 used, 2200616 buff/cache
- KiB Swap: 2047996 total, 2047996 free, 0 used. 1829288 avail Mem
-
- PID USER PR NI VIRT RES SHR S %CPU %MEM TIME+ COMMAND
- 19 root 20 0 0 0 0 S 55.6 0.0 0:43.76 ksoftirqd/2
- 24 root 20 0 0 0 0 R 50.9 0.0 0:33.38 ksoftirqd/3
- 406 root 0 -20 0 0 0 S 44.4 0.0 0:01.36 kworker/2:1H
- 405 root 20 0 0 0 0 R 43.5 0.0 0:07.08 xfsaild/sda2
- 865 root 20 0 250744 8372 4680 R 19.4 0.1 1:22.31 vmtoolsd
- 13 root rt 0 0 0 0 S 18.5 0.0 0:06.99 migration/1
- 61270 root 20 0 58544 2324 1528 R 5.6 0.0 0:00.06 top
- 53917 oracle 20 0 2051652 33636 29708 S 3.7 0.6 0:01.08 ora_m002_orcl
- 33319 root 20 0 0 0 0 R 2.8 0.0 1:07.99 kworker/u256:2
- 35576 root 20 0 0 0 0 S 2.8 0.0 0:04.65 kworker/0:0
- 61237 root 20 0 4964 1264 656 S 2.8 0.0 0:00.05 pidstat
- 61239 root 20 0 4964 1264 656 S 2.8 0.0 0:00.04 pidstat
- 52752 oracle -2 0 2050060 20348 17272 R 1.9 0.4 0:11.47 ora_vktm_orcl
- 61188 oracle 20 0 109132 1404 544 R 1.9 0.0 0:00.65 dd
- 61219 root 20 0 4396 760 632 S 1.9 0.0 0:00.02 mpstat
- 42985 root 20 0 0 0 0 S 0.9 0.0 0:03.32 kworker/u256:1
- 1 root 20 0 191272 4236 2588 S 0.0 0.1 0:11.09 systemd
- 2 root 20 0 0 0 0 S 0.0 0.0 0:00.02 kthreadd
5、使用oswbba查看收集的信息
- #####Oracle 提供了OSWbba(OS Watcher Black Box Analyzer)工具,可以分析收集的数据并用图表展示出来。
- [root@oracle19c oswbb]# java -jar oswbba.jar -i /root/oswbb/archive/
- Starting OSW Analyzer V8.4.0
- OSWatcher Analyzer Written by Oracle Center of Expertise
- Copyright (c) 2019 by Oracle Corporation
- Parsing Data. Please Wait...
- WARNING. oswbba has detected at least some of the files in you
- archive have been compressed. These files will not be analyzed.
- You must uncompress all the files in the archive for full
- analysis and graphing capabilities.
- Scanning file headers for version and platform info...
- Compressed file found. Ignoring oracle19c_iostat_21.08.27.1500.dat.gz ...
- Compressed file found. Ignoring oracle19c_pidstat_21.08.27.1500.dat.gz ...
- Parsing file oracle19c_pidstat_21.08.27.1600.dat ...
- Compressed file found. Ignoring oracle19c_iostat_21.08.27.1500.dat.gz ...
- Parsing file oracle19c_iostat_21.08.27.1600.dat ...
- This directory already exists. Rewriting...
- Parsing Completed.
- Enter 1 to Display CPU Process Queue Graphs
- Enter 2 to Display CPU Utilization Graphs
- Enter 3 to Display CPU Other Graphs
- Enter 4 to Display Memory Graphs
- Enter 5 to Display Disk IO Graphs
- Enter 61 to Display Individual OS Process I/O RPS Graphs
- Enter 62 to Display Individual OS Process I/O WPS Graphs
- Enter 63 to Display Individual OS Process Percent User CPU Graphs
- Enter 64 to Display Individual OS Process Percent System CPU Graphs
- Enter 65 to Display Individual OS Process Percent Total CPU (User + System) Graphs
- Enter 66 to Display Individual OS Process Percent Memory Graphs
-
- Enter GP to Generate Individual Process Profile
- Enter GC to Generate All CPU Gif Files
- Enter GM to Generate All Memory Gif Files
- Enter GD to Generate All Disk Gif Files
-
- Enter L to Specify Alternate Location of Gif Directory
- Enter Z to Zoom Graph Time Scale (Does not change analysis dataset)
- Enter B to Returns to Baseline Graph Time Scale (Does not change analysis dataset)
- Enter R to Remove Currently Displayed Graphs
-
- Enter X to Export Parsed Data to Flat File
- Enter S to Analyze Subset of Data(Changes analysis dataset including graph time scale)
- Enter A to Analyze Data
- Enter D to Generate DashBoard
-
- Enter Q to Quit Program
-
- Please Select an Option:5
- Device Name Average Wait Times in Milliseconds
-
- sda 87.03
- sdb 150.21
- Specify A Case Sensitive Device Name to View (Q to exit): sdb
- #####
-
备注:图表示例:展示的是sdb磁盘等待时间及繁忙状态
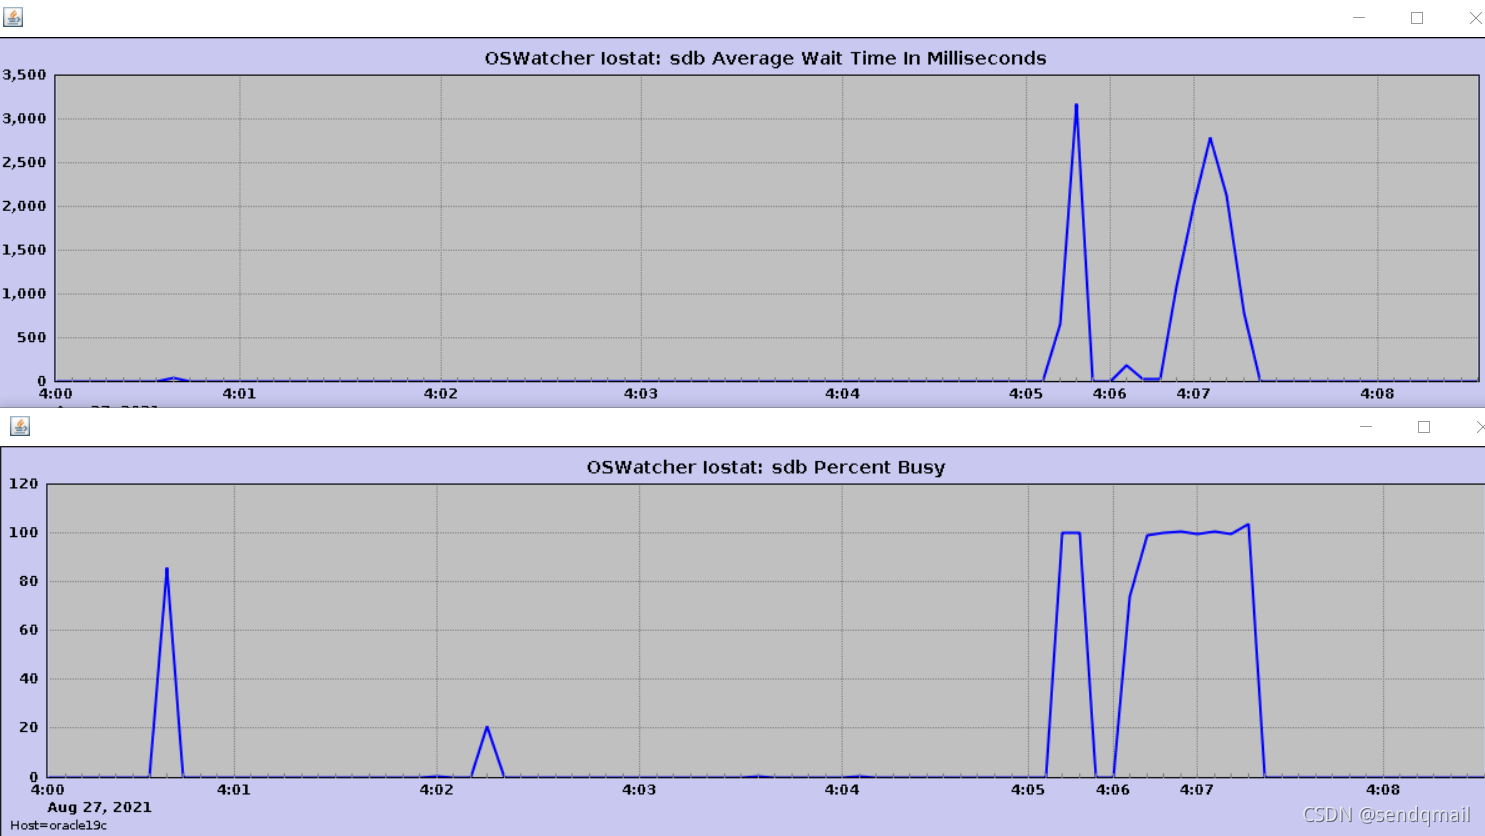
oswatcher更为具体的使用方法,请参考docs内的OSWatcherOverview_840.pdf文档。
文章知识点与官方知识档案匹配,可进一步学习相关知识
CS入门技能树Linux入门在线安装软件32637 人正在系统学习中