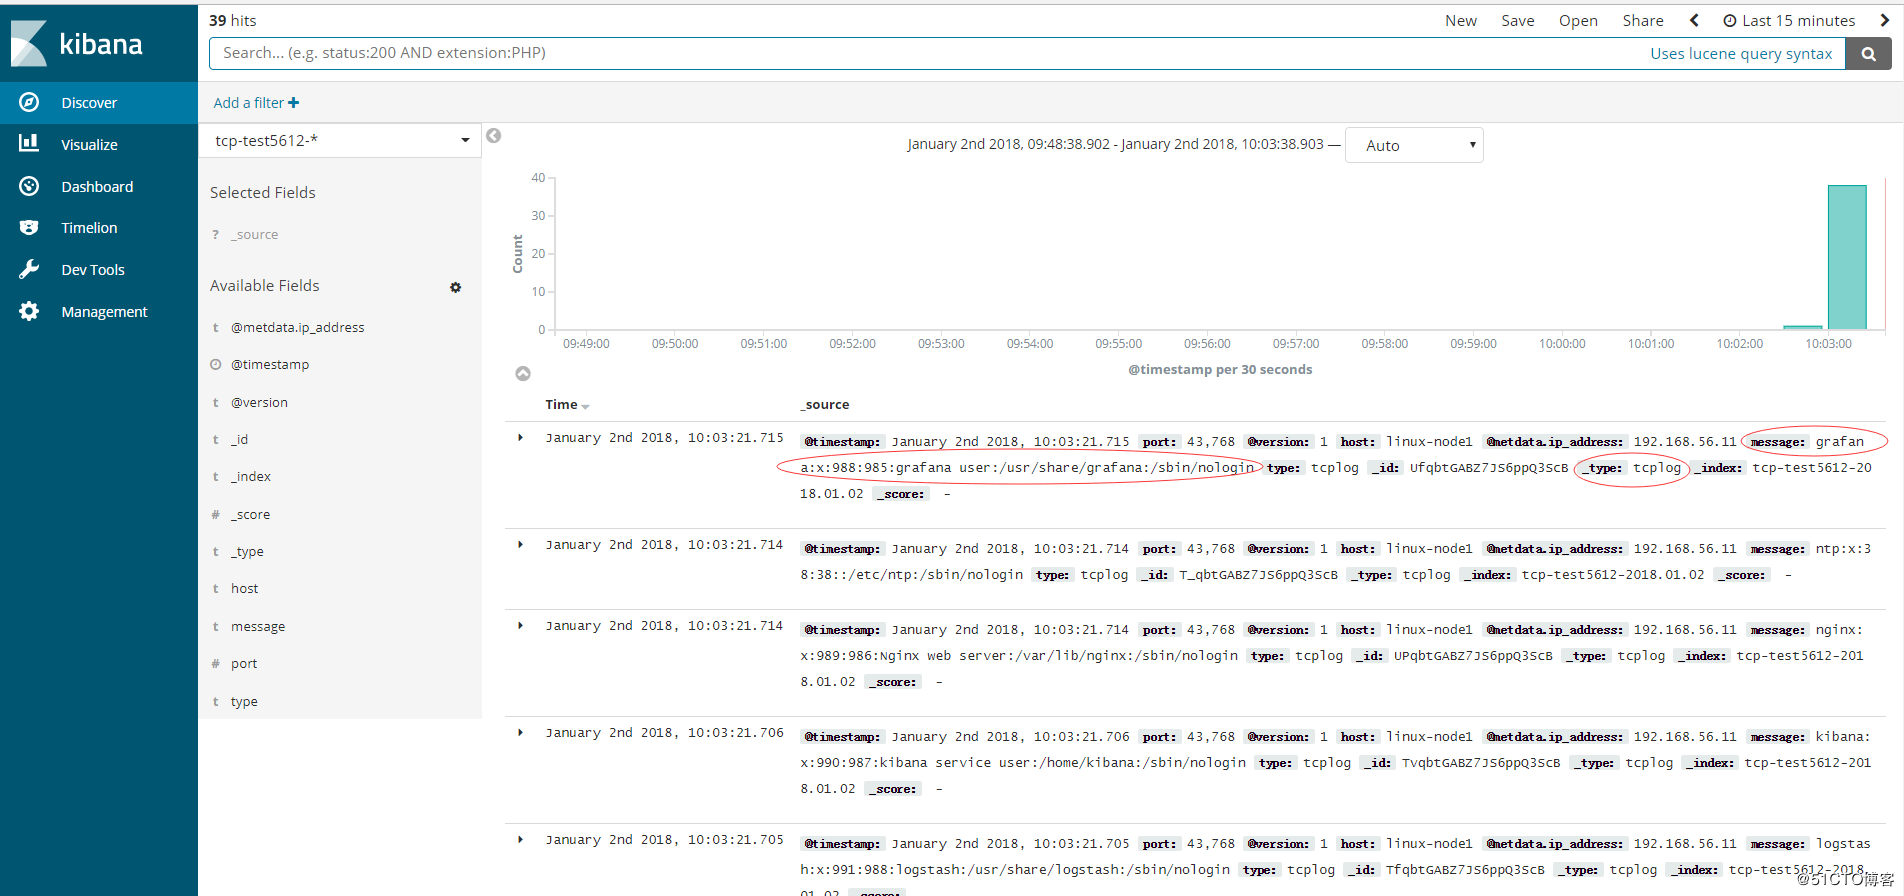
1、收集Nginx的json格式日志
1.1、Nginx安装
 View Code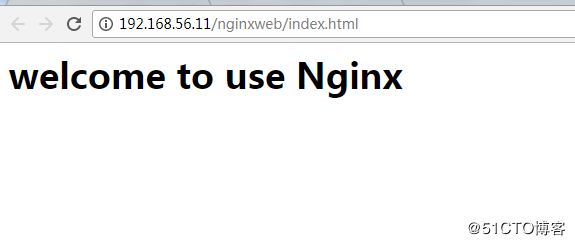
1.2、配置logstash

[root@linux-node1 ~]# vim /etc/logstash/conf.d/nginx-accesslog.conf
input{
    file {
        path => "/var/log/nginx/access.log"
        type => "nginx-access-log"
        start_position => "beginning"
        stat_interval => "2"
    }

}

output{
   elasticsearch {
        hosts => ["192.168.56.11:9200"]
        index => "logstash-nginx-access-log-%{+YYYY.MM.dd}"
   }
   file {
        path => "/tmp/logstash-nginx-access-log-%{+YYYY.MM.dd}"
   }
}
[root@linux-node1 ~]# /usr/share/logstash/bin/logstash -f /etc/logstash/conf.d/nginx_access.conf -t
[root@linux-node1 ~]# systemctl restart logstash
1.3、配置Kibana展示
[root@linux-node1 ~]# ab -n1000 -c 100 http://192.168.56.11/nginxweb/index.html    #对页面压测
[root@linux-node1 ~]# tailf /var/log/nginx/access.log    #nginx的访问日志变成了json格式
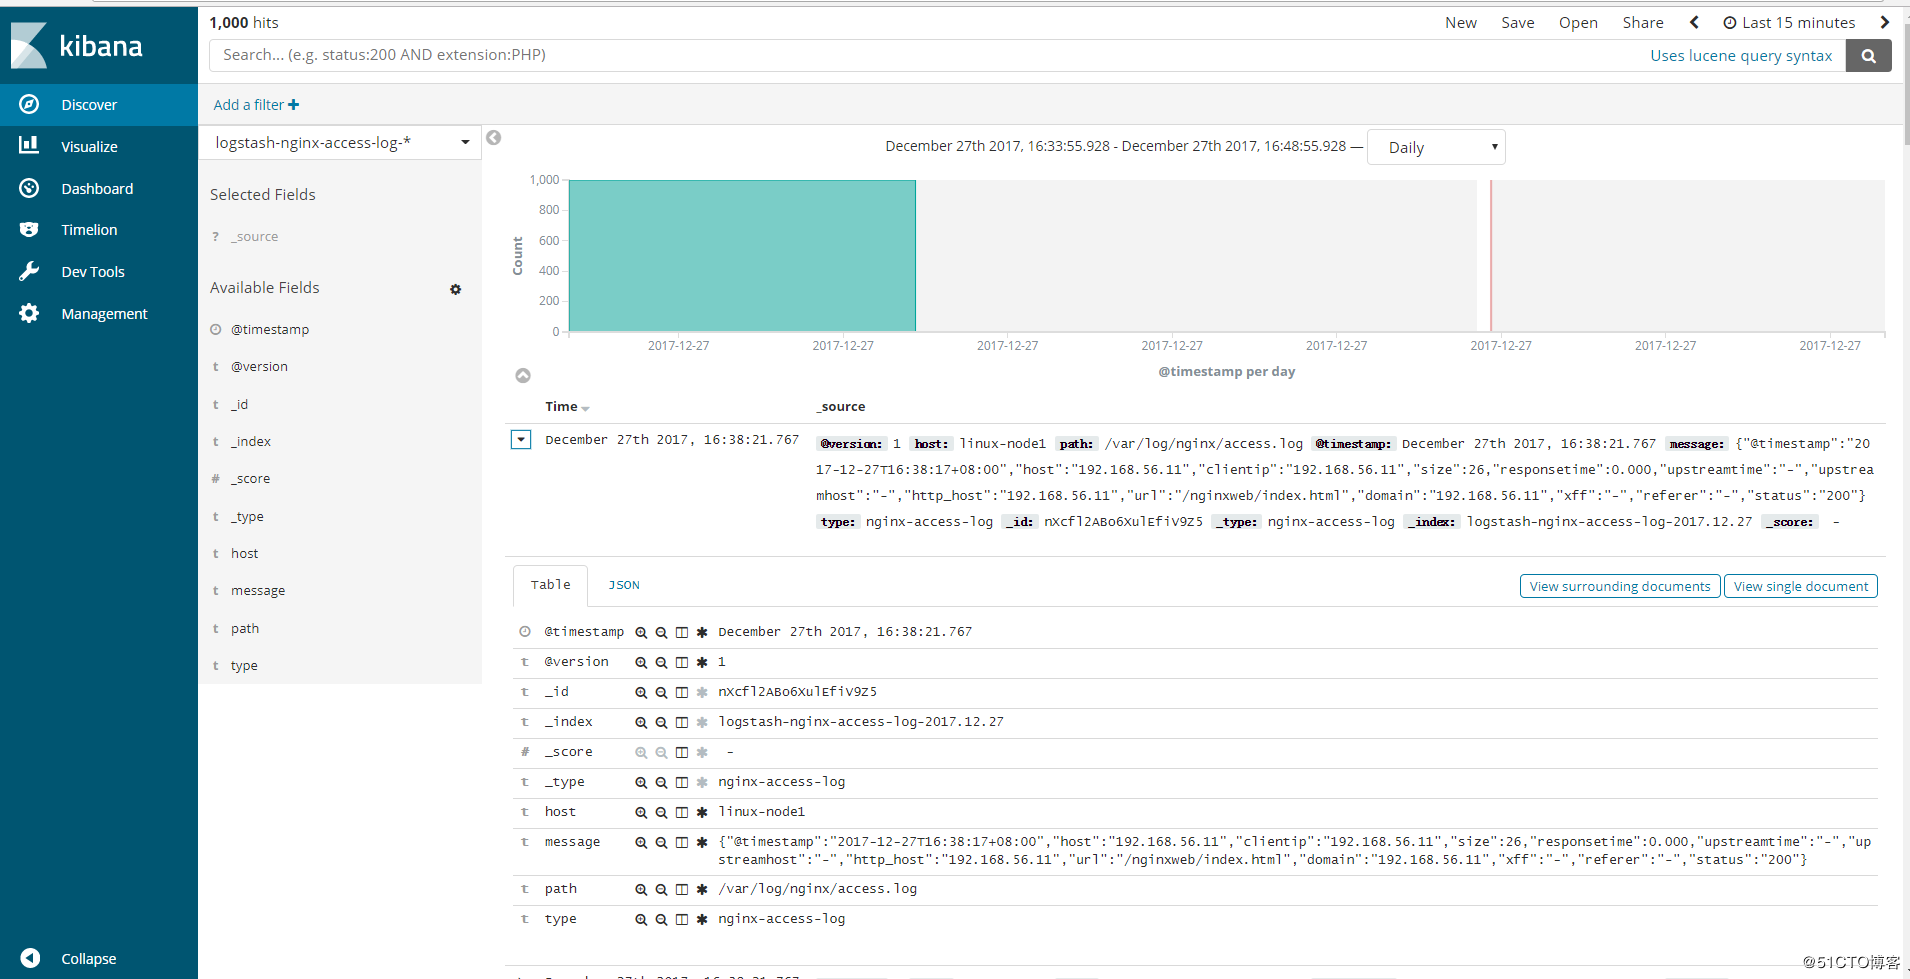
{"@timestamp":"2017-12-27T16:38:17+08:00","host":"192.168.56.11","clientip":"192.168.56.11","size":26,"responsetime":0.000,"upstreamtime":"-","upstreamhost":"-","http_host":"192.168.56.11","url":"/nginxweb/index.html","domain":"192.168.56.11","xff":"-","referer":"-","status":"200"}
{"@timestamp":"2017-12-27T16:38:17+08:00","host":"192.168.56.11","clientip":"192.168.56.11","size":26,"responsetime":0.000,"upstreamtime":"-","upstreamhost":"-","http_host":"192.168.56.11","url":"/nginxweb/index.html","domain":"192.168.56.11","xff":"-","referer":"-","status":"200"}
{"@timestamp":"2017-12-27T16:38:17+08:00","host":"192.168.56.11","clientip":"192.168.56.11","size":26,"responsetime":0.000,"upstreamtime":"-","upstreamhost":"-","http_host":"192.168.56.11","url":"/nginxweb/index.html","domain":"192.168.56.11","xff":"-","referer":"-","status":"200"}
{"@timestamp":"2017-12-27T16:38:17+08:00","host":"192.168.56.11","clientip":"192.168.56.11","size":26,"responsetime":0.000,"upstreamtime":"-","upstreamhost":"-","http_host":"192.168.56.11","url":"/nginxweb/index.html","domain":"192.168.56.11","xff":"-","referer":"-","status":"200"}
{"@timestamp":"2017-12-27T16:38:17+08:00","host":"192.168.56.11","clientip":"192.168.56.11","size":26,"responsetime":0.000,"upstreamtime":"-","upstreamhost":"-","http_host":"192.168.56.11","url":"/nginxweb/index.html","domain":"192.168.56.11","xff":"-","referer":"-","status":"200"}
{"@timestamp":"2017-12-27T16:38:17+08:00","host":"192.168.56.11","clientip":"192.168.56.11","size":26,"responsetime":0.000,"upstreamtime":"-","upstreamhost":"-","http_host":"192.168.56.11","url":"/nginxweb/index.html","domain":"192.168.56.11","xff":"-","referer":"-","status":"200"}
{"@timestamp":"2017-12-27T16:38:17+08:00","host":"192.168.56.11","clientip":"192.168.56.11","size":26,"responsetime":0.000,"upstreamtime":"-","upstreamhost":"-","http_host":"192.168.56.11","url":"/nginxweb/index.html","domain":"192.168.56.11","xff":"-","referer":"-","status":"200"}
{"@timestamp":"2017-12-27T16:38:17+08:00","host":"192.168.56.11","clientip":"192.168.56.11","size":26,"responsetime":0.000,"upstreamtime":"-","upstreamhost":"-","http_host":"192.168.56.11","url":"/nginxweb/index.html","domain":"192.168.56.11","xff":"-","referer":"-","status":"200"}
{"@timestamp":"2017-12-27T16:38:17+08:00","host":"192.168.56.11","clientip":"192.168.56.11","size":26,"responsetime":0.000,"upstreamtime":"-","upstreamhost":"-","http_host":"192.168.56.11","url":"/nginxweb/index.html","domain":"192.168.56.11","xff":"-","referer":"-","status":"200"}
{"@timestamp":"2017-12-27T16:38:17+08:00","host":"192.168.56.11","clientip":"192.168.56.11","size":26,"responsetime":0.000,"upstreamtime":"-","upstreamhost":"-","http_host":"192.168.56.11","url":"/nginxweb/index.html","domain":"192.168.56.11","xff":"-","referer":"-","status":"200"}
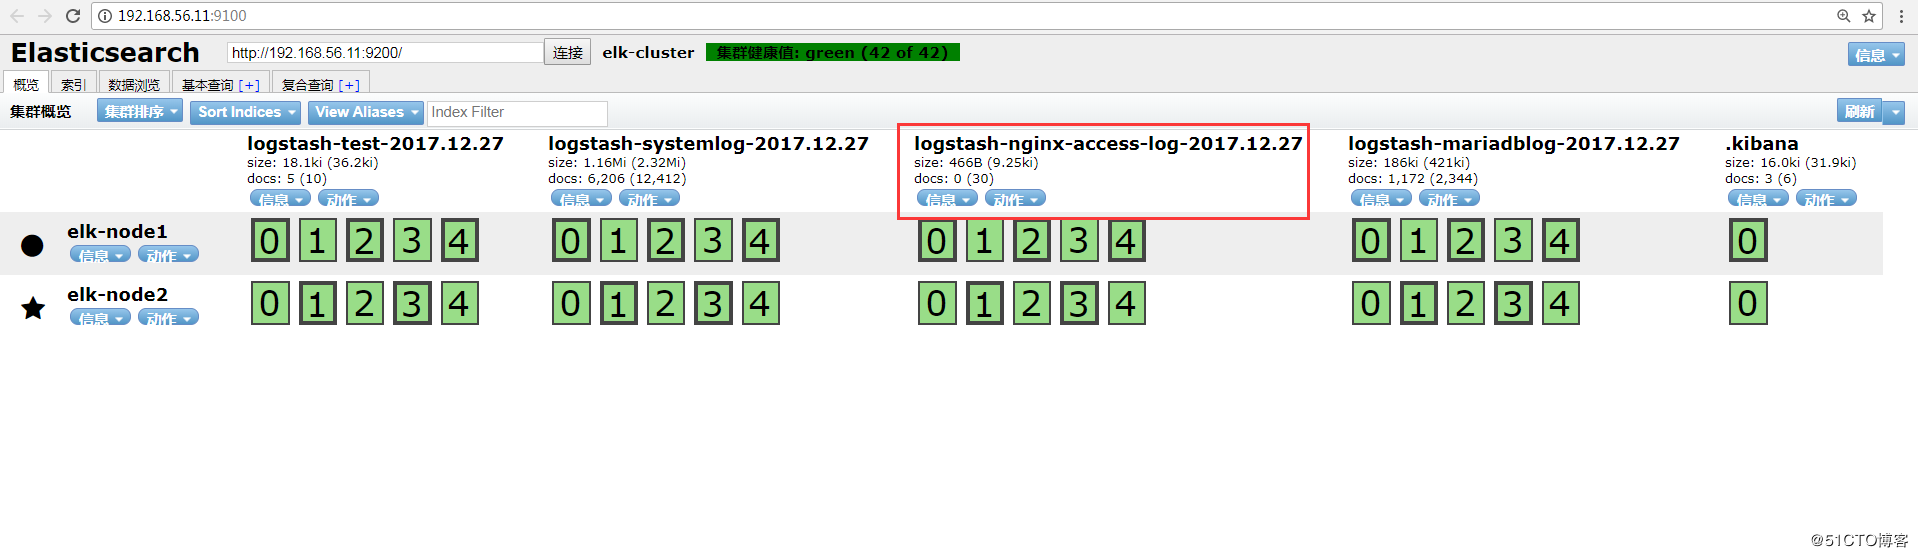
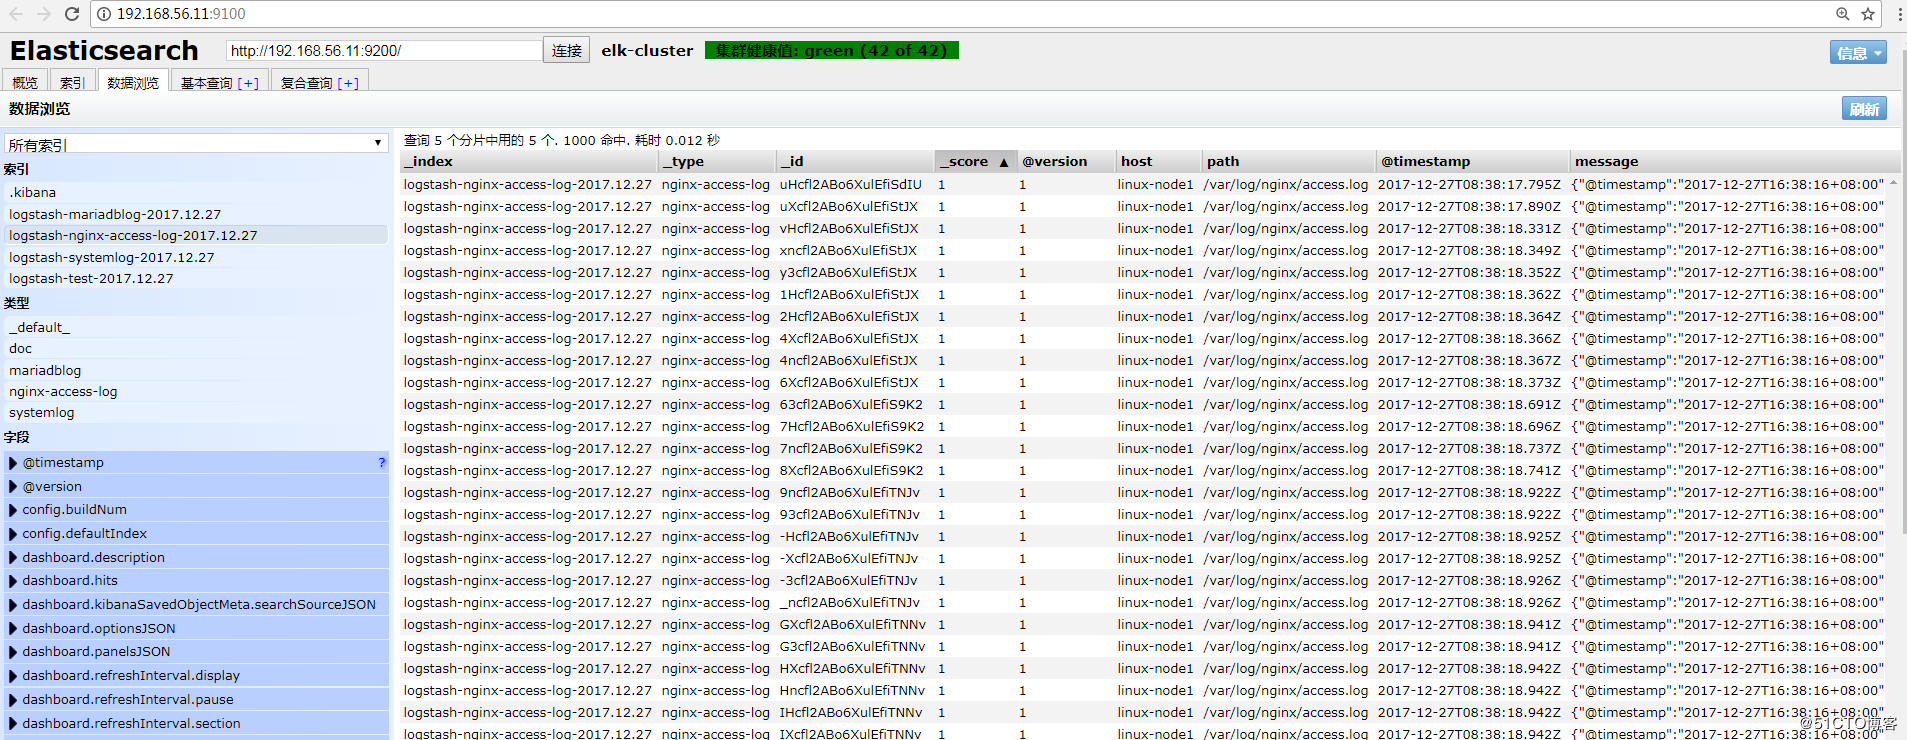
Head插件查看:
Kibana查看:
2、Tomcat的json日志收集
2.1、下载tomcat
[root@linux-node2 ~]# wget http://apache.fayea.com/tomcat/tomcat-8/v8.5.20/bin/apache-tomcat-8.5.20.tar.gz
[root@linux-node2 ~]# tar -zxf apache-tomcat-8.5.24.tar.gz
[root@linux-node2 ~]# mv apache-tomcat-8.5.24 /usr/local/tomcat
2.2、修改tomcat日志格式
[root@linux-node2 ~]# cd /usr/local/tomcat/conf
[root@linux-node2 conf ]# cp server.xml{,.bak}
[root@linux-node2 conf ]# vim server.xml
<Valve className="org.apache.catalina.valves.AccessLogValve" directory="logs"
               prefix="tomcat_access_log" suffix=".log"
               pattern="{"clientip":"%h","ClientUser":"%l","authenticated":"%u","AccessTime":"%t","method":"%r","status":"%s","SendBytes":"%b","Query?string":"%q","partner":"%{Referer}i","AgentVersion":"%{User-Agent}i"}"/>
2.3、增加tomcat网页
View Code2.4、压测页面,生成tomcat的访问日志
View Code2.5、配置logstash
View Code2.6、检查logstash的配置语法并重启logstash
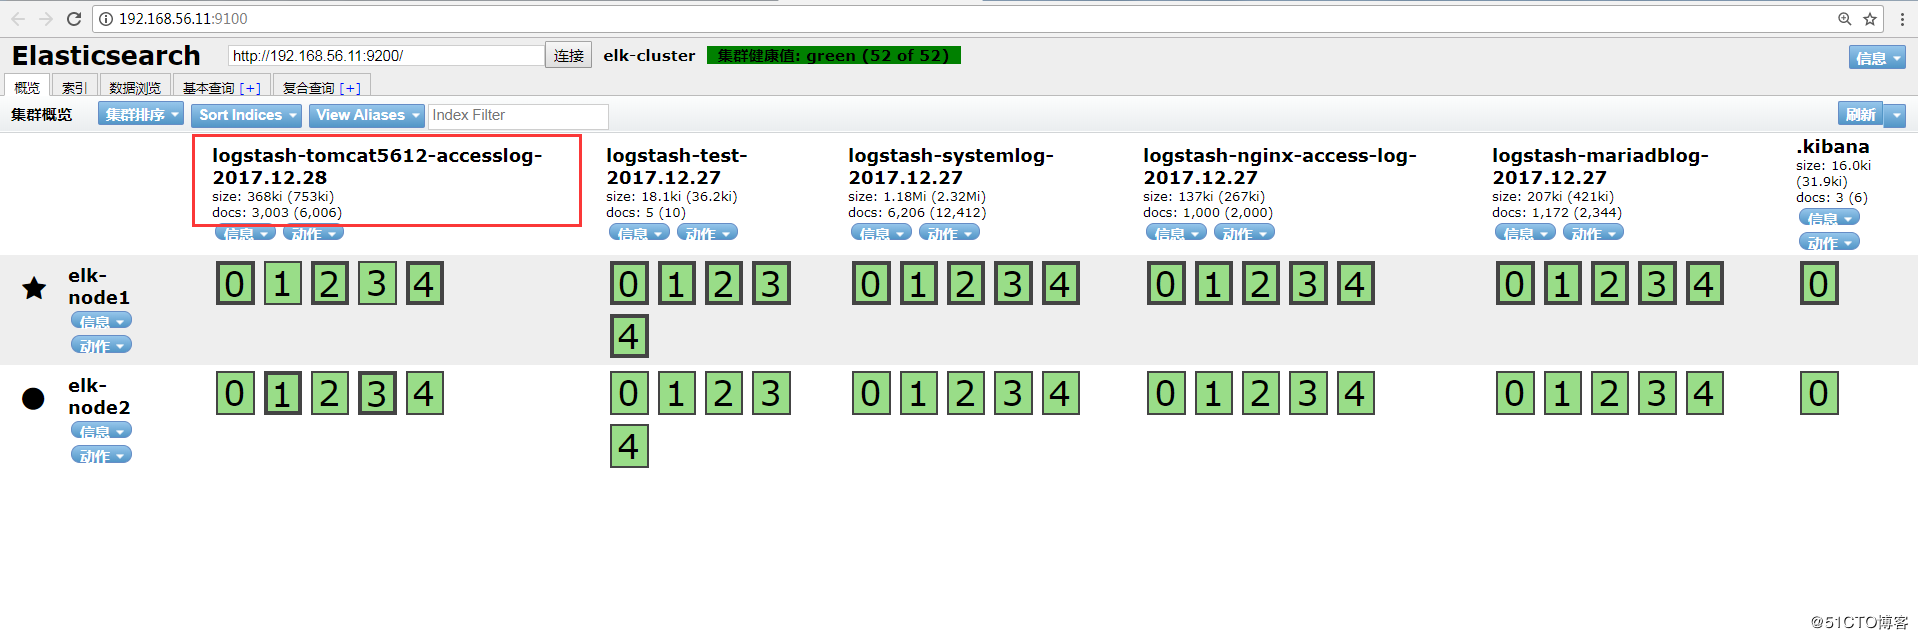
View Code2.7、elasticsearch的head插件查看
数据浏览:
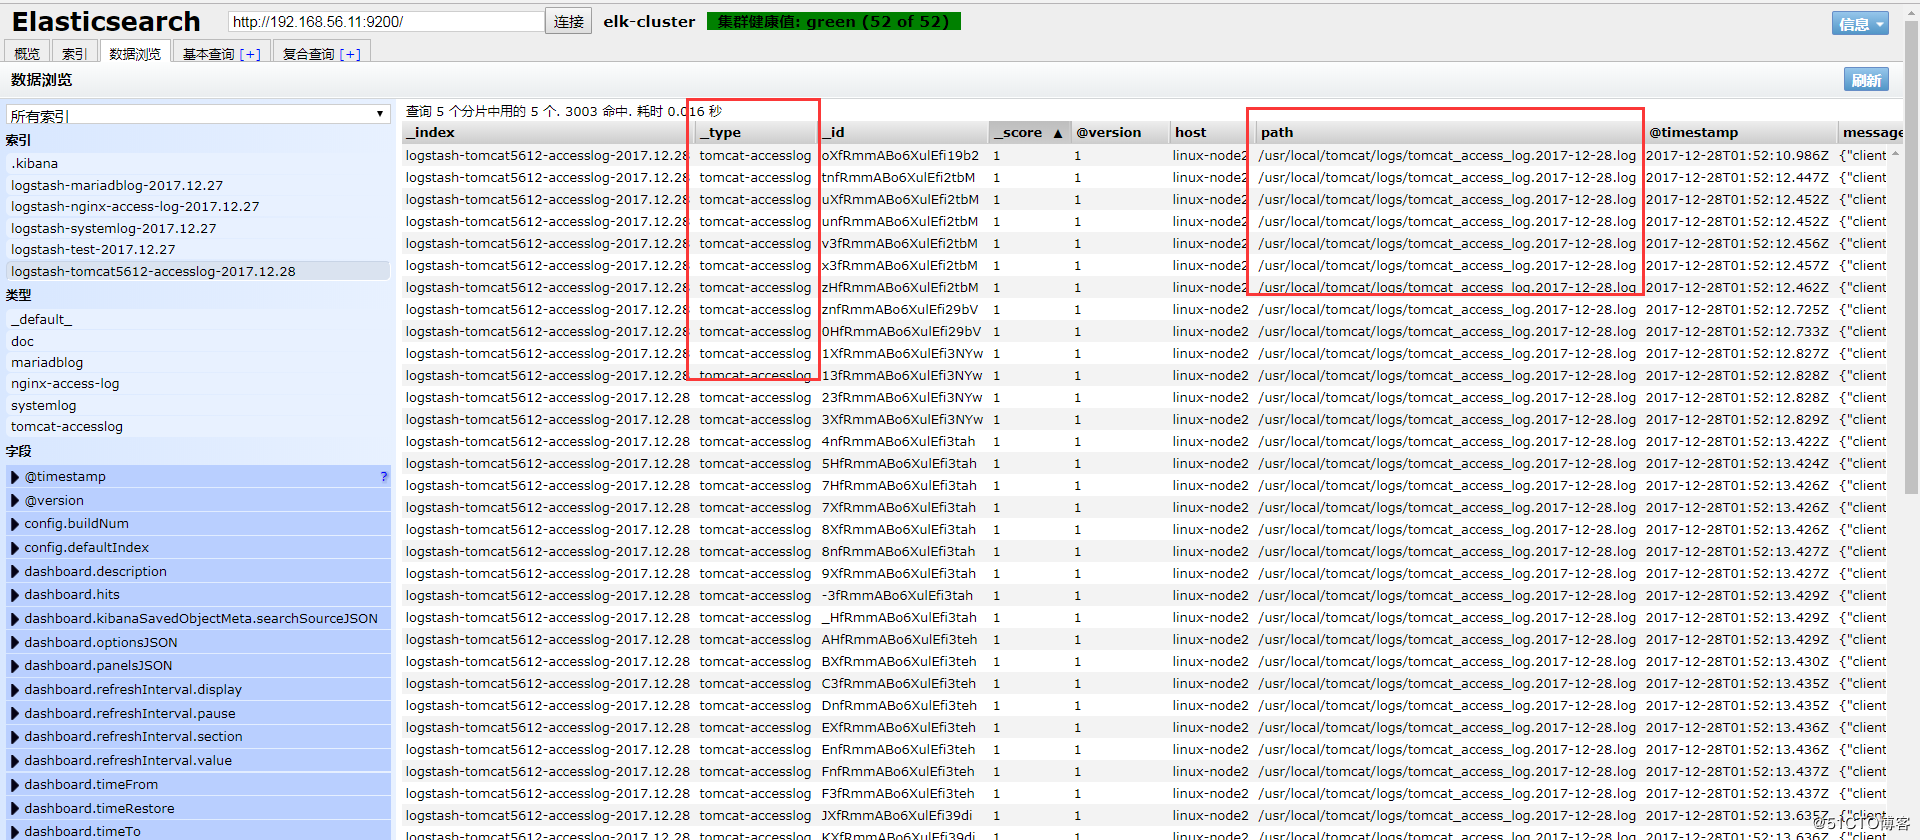
注:此处如果无法出现tomcat的数据索引,查看一下是否有权限访问日志。
[root@linux-node2 logs]# ll /usr/local/tomcat/logs/ -d
drwxr-x--- 2 root root 4096 12月 28 09:29 /usr/local/tomcat/logs/
[root@linux-node2 logs]# chmod 755 /usr/local/tomcat/logs
[root@linux-node2 logs]# ll /usr/local/tomcat/logs/
总用量 512
-rw-r----- 1 root root   7140 12月 28 09:29 catalina.2017-12-28.log
-rw-r----- 1 root root   7140 12月 28 09:29 catalina.out
-rw-r----- 1 root root      0 12月 28 09:29 host-manager.2017-12-28.log
-rw-r----- 1 root root    284 12月 28 09:29 localhost.2017-12-28.log
-rw-r----- 1 root root      0 12月 28 09:29 manager.2017-12-28.log
-rw-r----- 1 root root 502039 12月 28 09:47 tomcat_access_log.2017-12-28.log
[root@linux-node2 logs]# chmod 644 /usr/local/tomcat/logs/
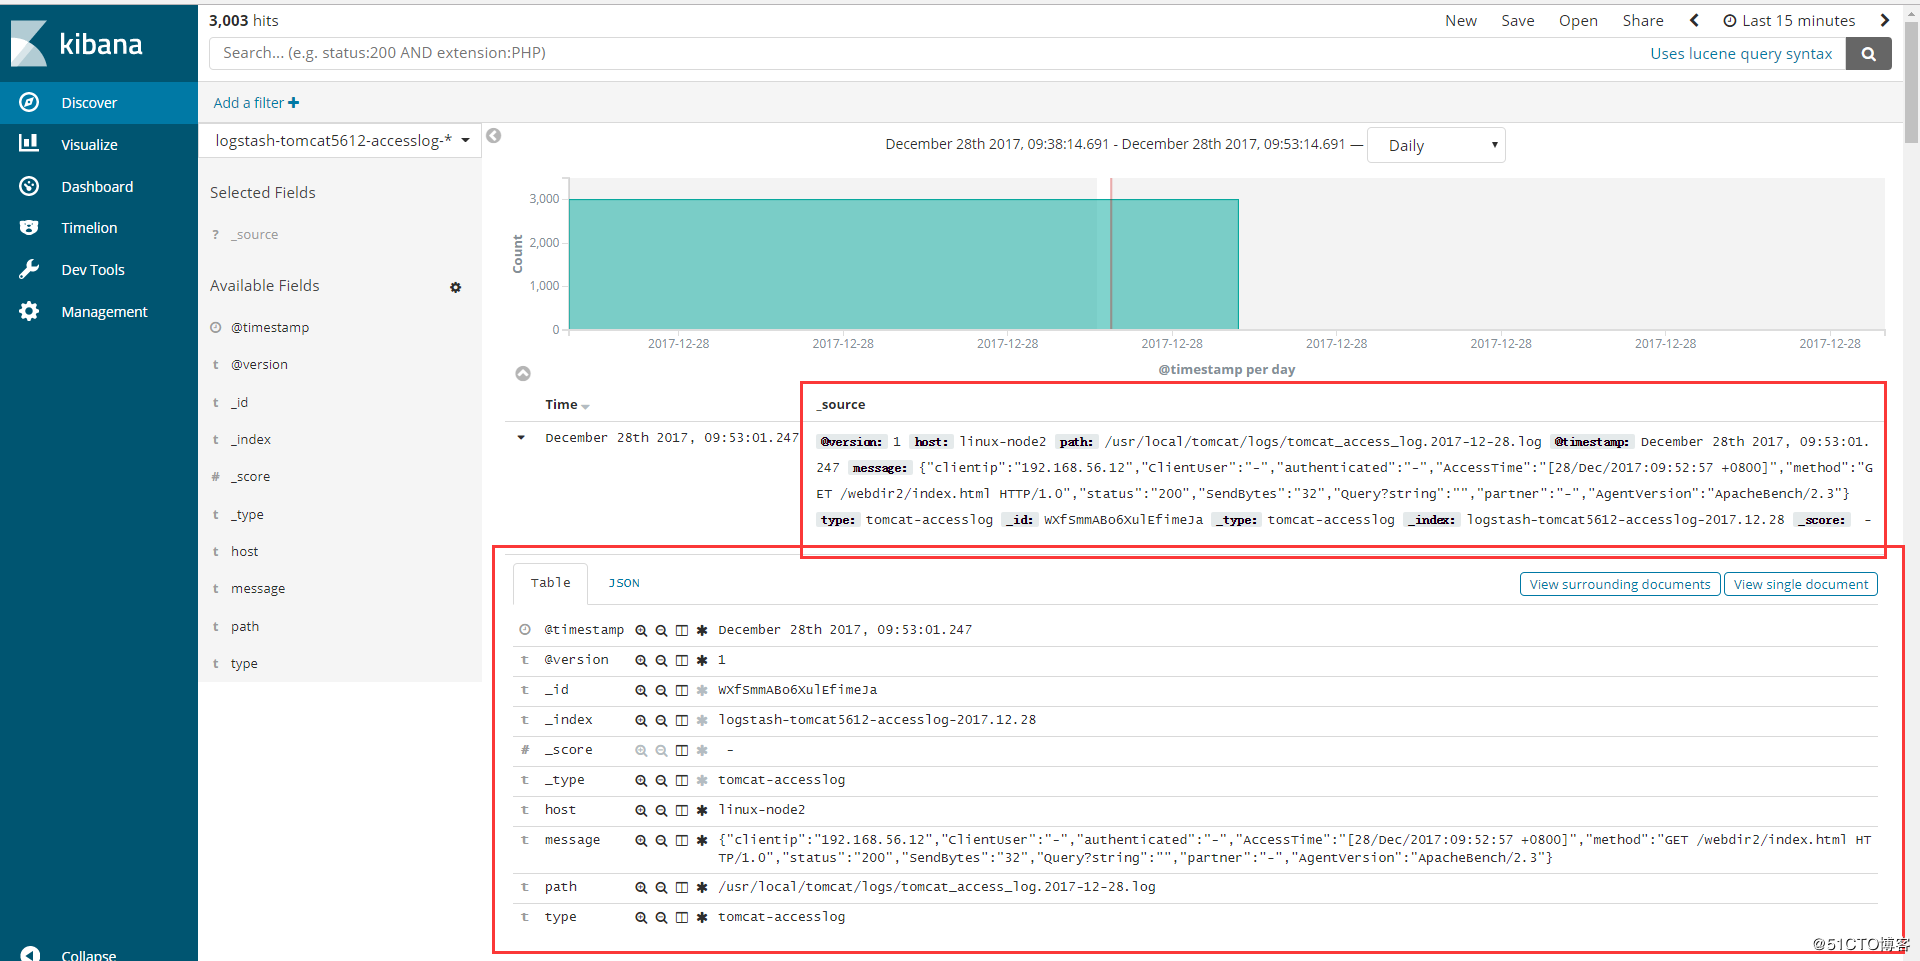
2.8、添加到Kibana
3、Java日志收集
使用codec的multiline插件实现多行匹配,这是一个可以将多行进行合并的插件,而且可以使用what指定将匹配到的行与前面的行合并还是和后面的行合并。
https://www.elastic.co/guide/en/logstash/6.0/plugins-codecs-multiline.html
View Code3.1、举例
(1)查看elk集群日志
elk集群日志上都是以”[“开头并且每一个信息都是如此,寻找规律
[root@linux-node1 ~]# tailf /data/logs/elk-cluster.log
[2017-12-28T09:36:58,486][INFO ][o.e.c.s.MasterService    ] [elk-node1] zen-disco-node-join[{elk-node2}{CcF5fl9sRqCAGYYpT3scuw}{ncgZ1UsPRq-iz6zWHPl7PQ}{192.168.56.12}{192.168.56.12:9300}], reason: added {{elk-node2}{CcF5fl9sRqCAGYYpT3scuw}{ncgZ1UsPRq-iz6zWHPl7PQ}{192.168.56.12}{192.168.56.12:9300},}
[2017-12-28T09:36:59,297][INFO ][o.e.c.s.ClusterApplierService] [elk-node1] added {{elk-node2}{CcF5fl9sRqCAGYYpT3scuw}{ncgZ1UsPRq-iz6zWHPl7PQ}{192.168.56.12}{192.168.56.12:9300},}, reason: apply cluster state (from master [master {elk-node1}{Ulw9eIPlS06sl8Z6zQ_z4g}{HgJRMEAcQcqFOTn5ehHPdw}{192.168.56.11}{192.168.56.11:9300} committed version [87] source [zen-disco-node-join[{elk-node2}{CcF5fl9sRqCAGYYpT3scuw}{ncgZ1UsPRq-iz6zWHPl7PQ}{192.168.56.12}{192.168.56.12:9300}]]])
[2017-12-28T09:36:59,310][WARN ][o.e.d.z.ElectMasterService] [elk-node1] value for setting "discovery.zen.minimum_master_nodes" is too low. This can result in data loss! Please set it to at least a quorum of master-eligible nodes (current value: [-1], total number of master-eligible nodes used for publishing in this round: [2])
[2017-12-28T09:37:06,580][INFO ][o.e.c.r.a.AllocationService] [elk-node1] Cluster health status changed from [YELLOW] to [GREEN] (reason: [shards started [[.kibana][0]] ...]).
[2017-12-28T09:52:11,090][INFO ][o.e.c.m.MetaDataCreateIndexService] [elk-node1] [logstash-tomcat5612-accesslog-2017.12.28] creating index, cause [auto(bulk api)], templates [logstash], shards [5]/[1], mappings [_default_]
[2017-12-28T09:52:11,433][INFO ][o.e.c.m.MetaDataMappingService] [elk-node1] [logstash-tomcat5612-accesslog-2017.12.28/YY4yqUQJRHa2mRUwmd2Y8g] create_mapping [tomcat-accesslog]
[2017-12-28T09:52:13,389][INFO ][o.e.c.r.a.AllocationService] [elk-node1] Cluster health status changed from [YELLOW] to [GREEN] (reason: [shards started [[logstash-tomcat5612-accesslog-2017.12.28][4]] ...]).
(2)配置logstash
View Code(3)elasticsearch的head插件查看
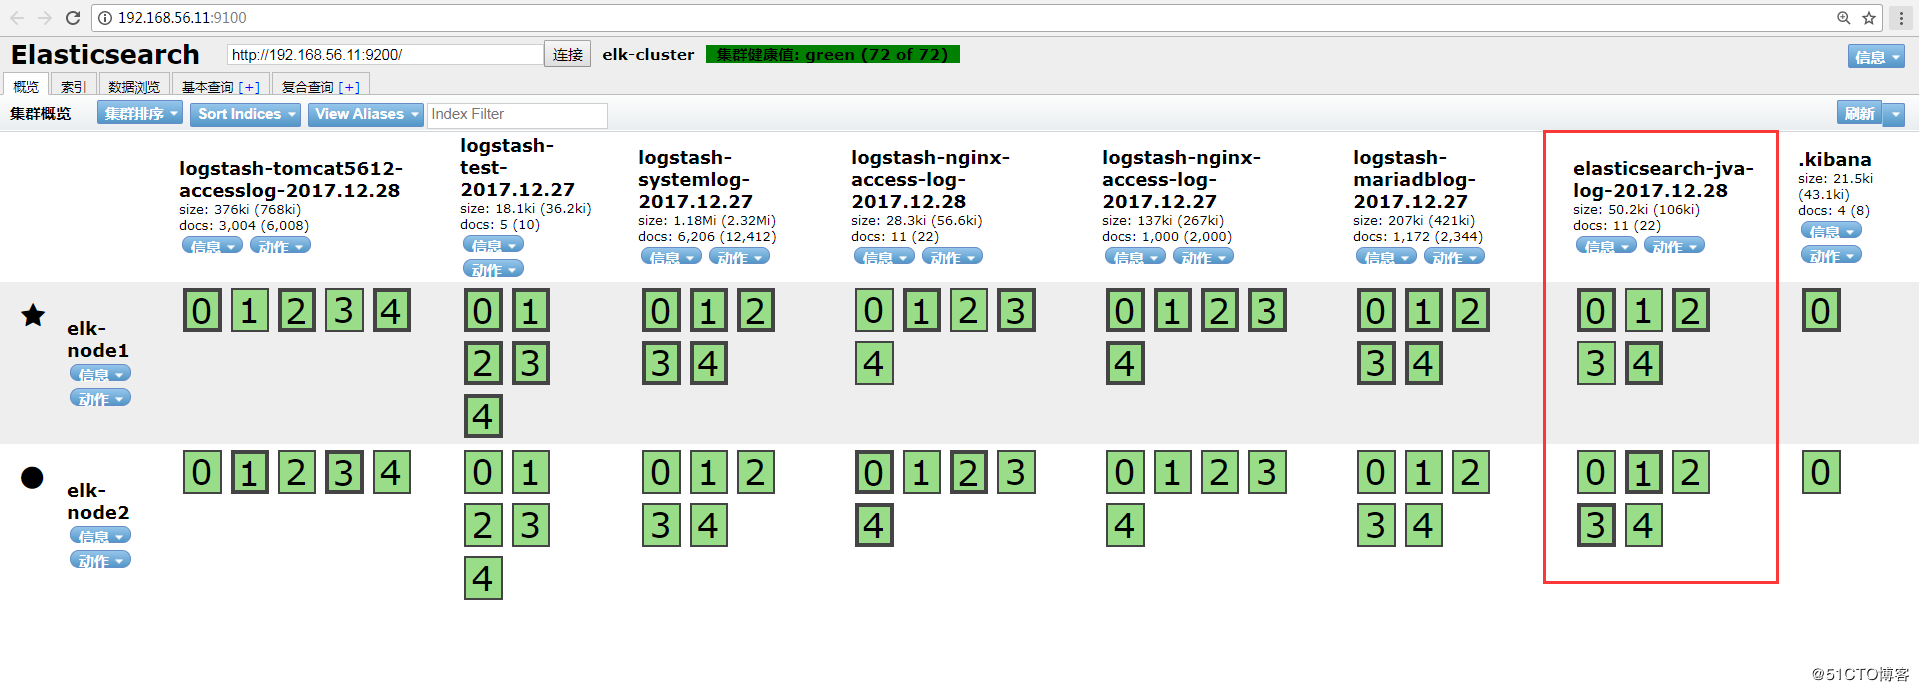
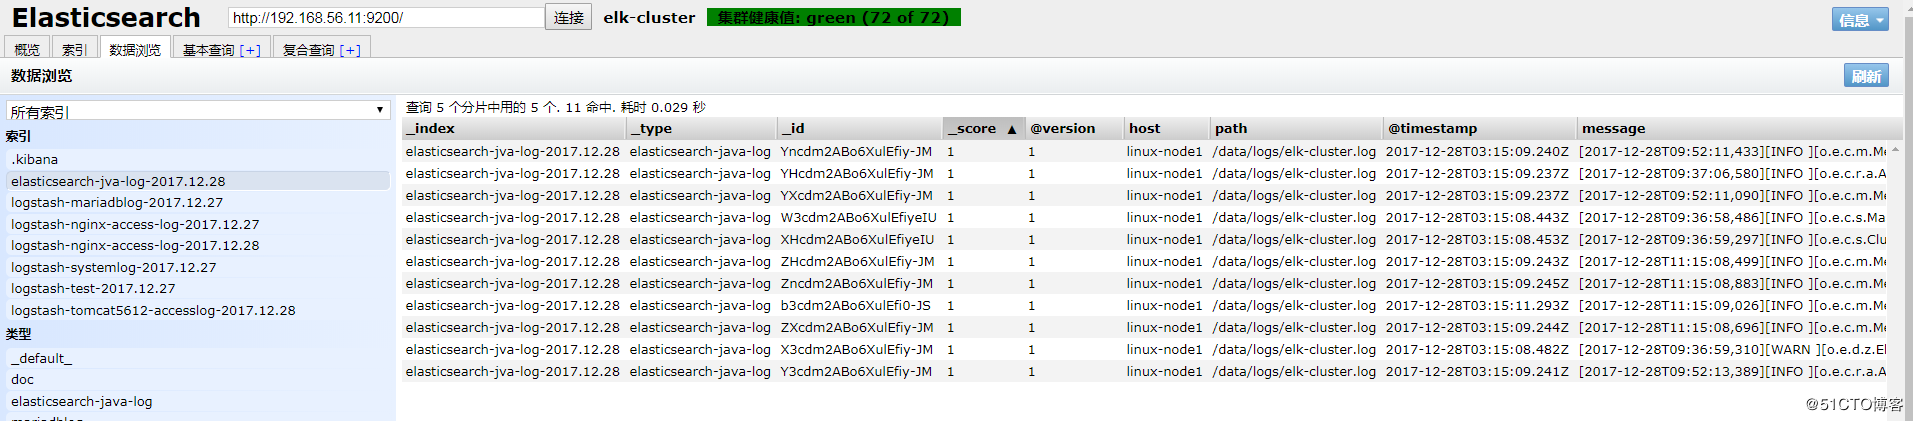
数据浏览:
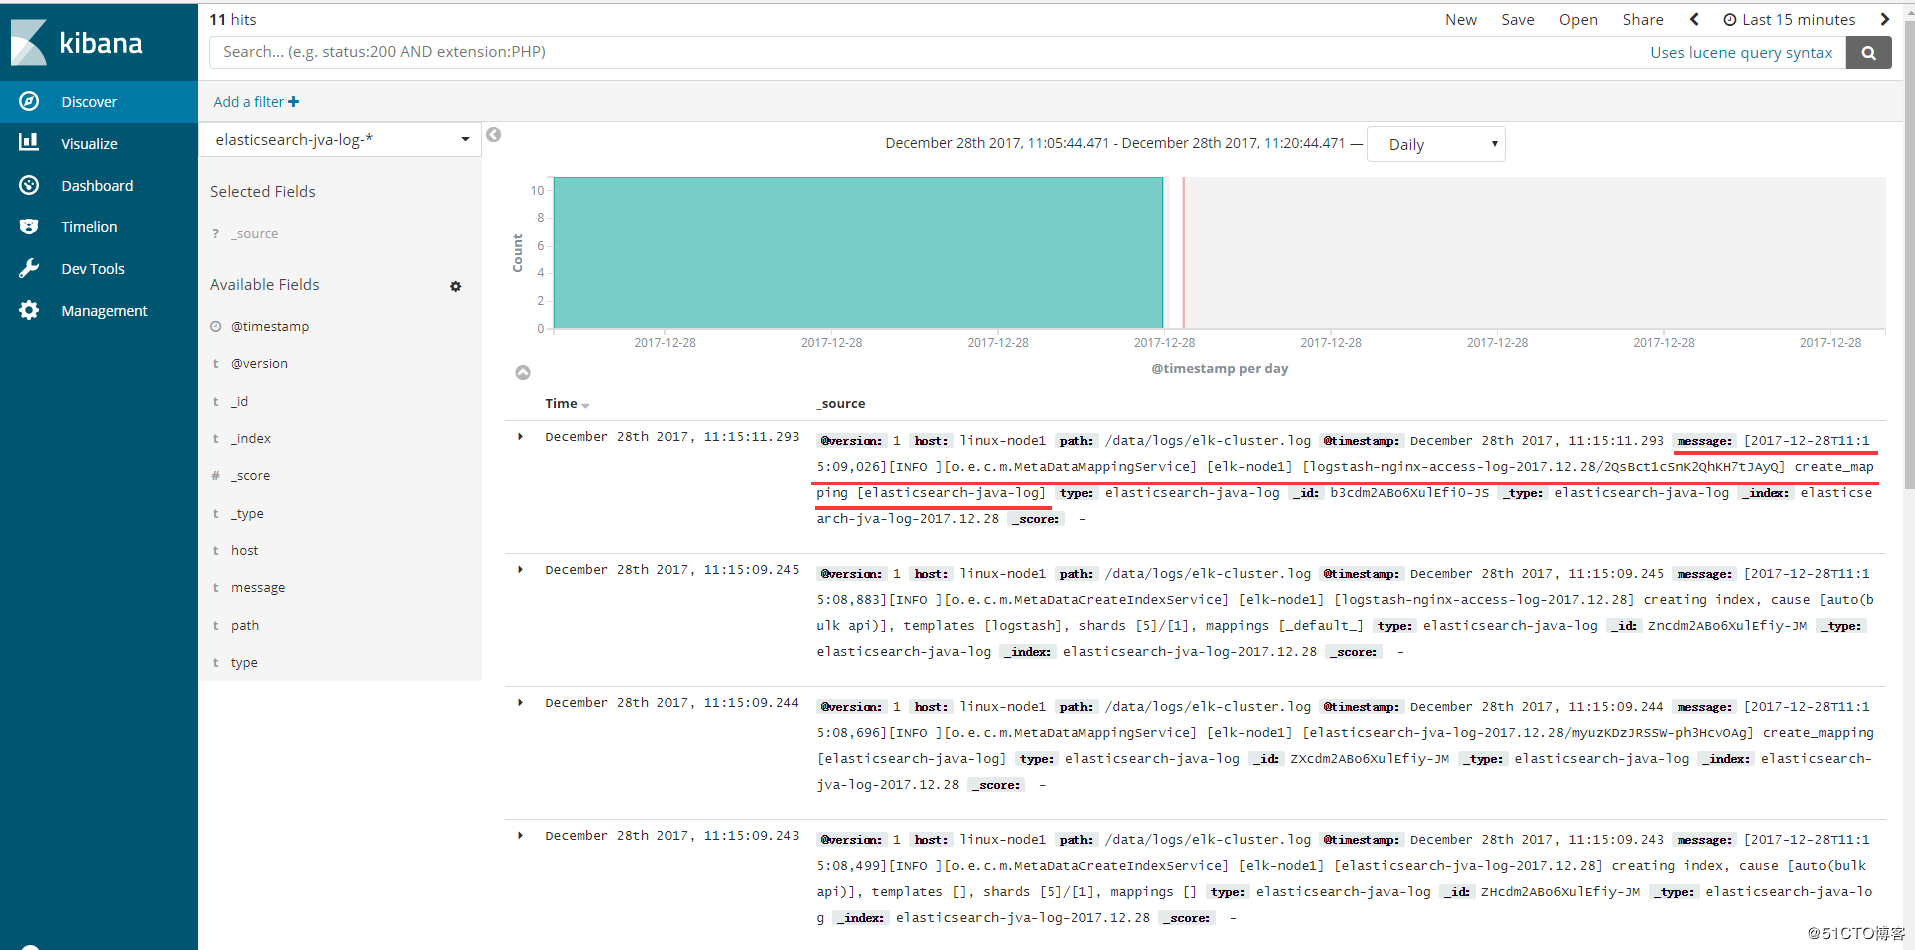
(4)添加到Kibana

可以看到以“[”开头的信息都合并了,如图:
4、TCP收集日志使用场景
tcp模块的使用场景如下: 有一台服务器A只需要收集一个日志,那么我们就可以不需要在这服务器上安装logstash,我们通过在其他logstash上启用tcp模块,监听某个端口,然后我们在这个服务器A把日志通过nc发送到logstash上即可。
4.1、标准输出测试TCP模块
View Code4.2、配置logstash通过TCP收集输出到elasticsearch
View CodeHEAD插件查看:
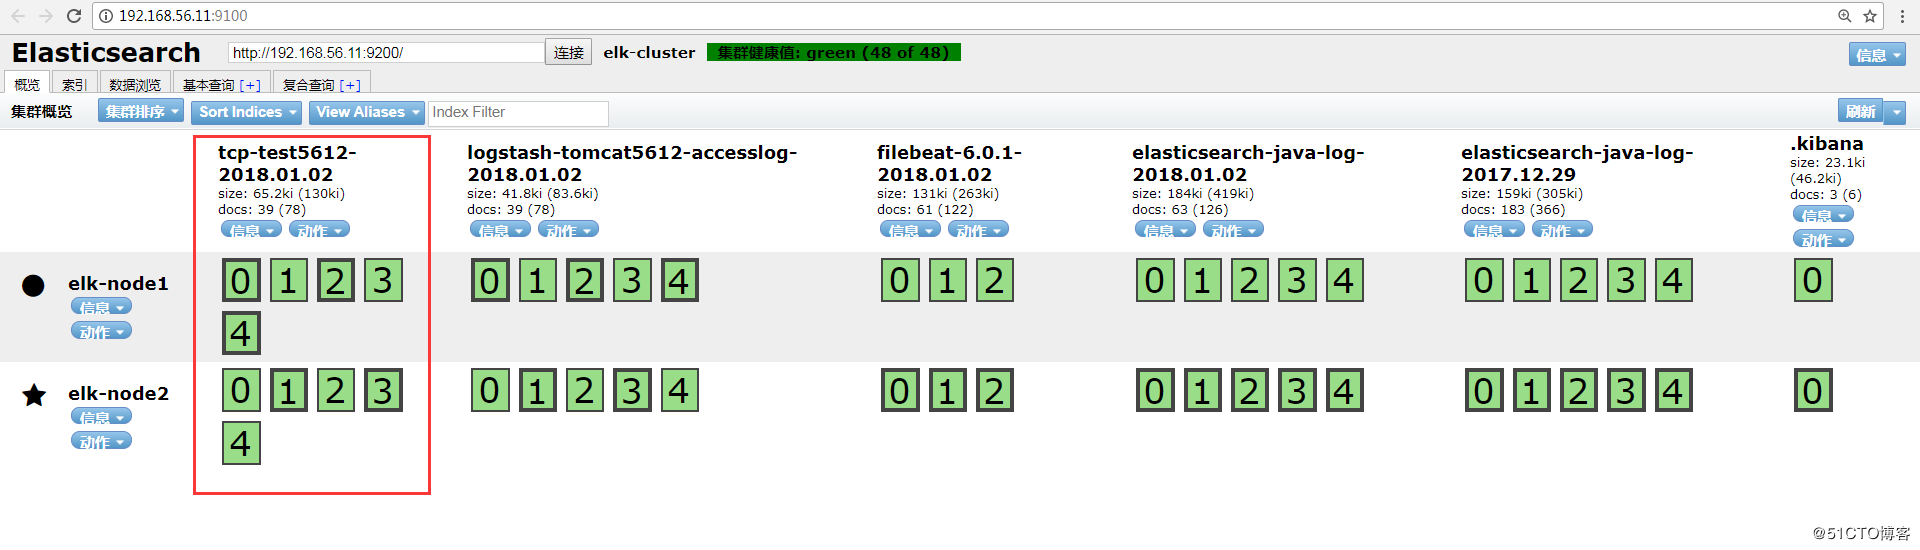
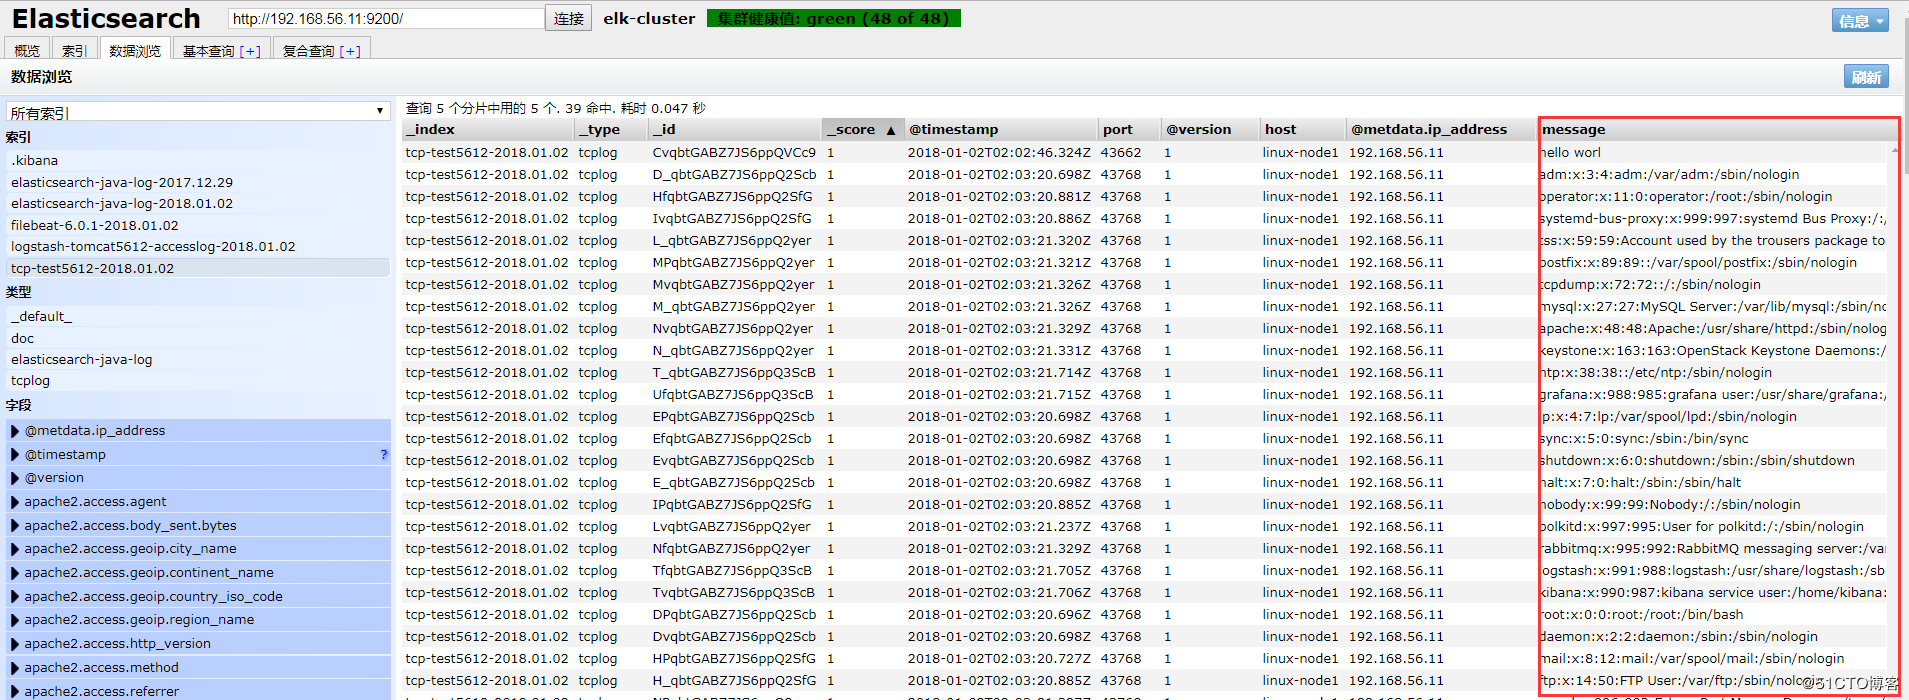
Kibana添加索引查看: